
“I think the worst case for sea level rise by the end of this century is up around 55 inches. And if you get an inch rise in sea level, you will displace the vegetation and animals a mile inland in those areas. Fifty five inches could displace 55 miles inland.”
– Lonnie Thompson, Ph.D., Ohio State University

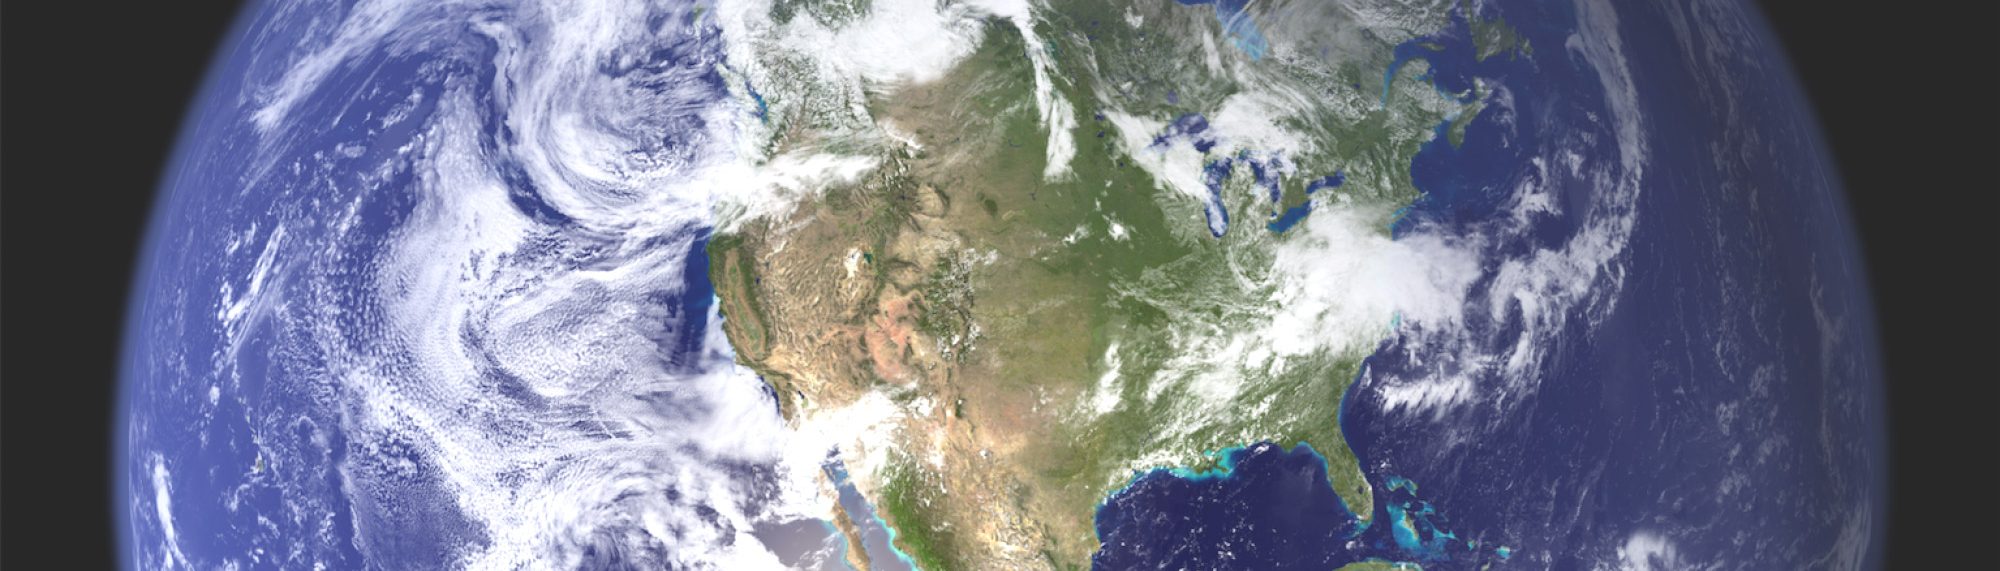
Updated: February 2, 2007 Columbus, Ohio and Davis, California – The United Nation’s Intergovernmental Panel On Climate Change, known as the IPCC, has been working on another report since its last one in 2001. This is supposed to be a consensus from scientists and computer labs around the world about where global climate change is headed.

Climate Change 2007: The Physical Science Basis
This report says it is “very likely” (90% likelihood) that increasing carbon dioxide is caused by human activity. The report also acknowledges that there has been an increase in stronger storms in various parts of the world – and specifically, storms in North and South America are linked to global warming.
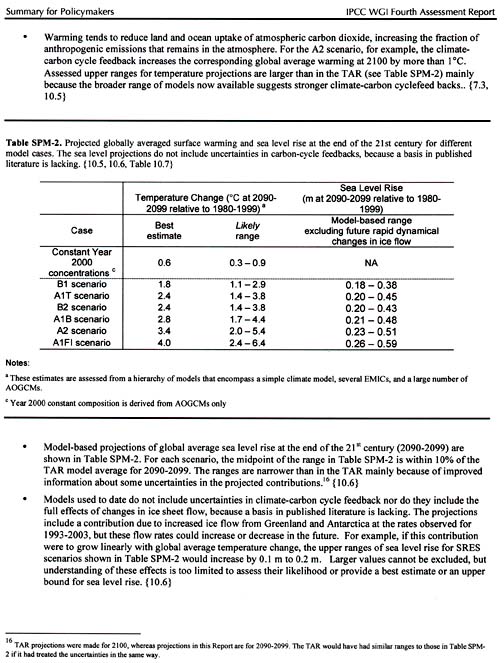
How high does the IPCC now think the average global temperature will rise over the next ninety years? Updated final projections: The official February 2, 2007, public report says by the year 2100, Earth could warm up in a range of scenarios from 1.8 degrees to 6.4 degrees Celsius, which is 3.2 to 11.52 degrees Fahrenheit. That upper 11.52 degrees F. is even higher than the previous 2001 projection of about 10 degrees F. It means in the worst case, each coming decade could warm at least one degree Fahrenheit! For comparison, it took the previous 100 years for the Earth to warm up 1 degree Fahrenheit.
And how high will sea levels rise? For reasons that are not clear, the rapidly increasing ice melts of Antarctica and Greenland were left out of the initial draft of the IPCC’s 2007 report – allegedly because computer models don’t have current data to accurately access the impact. The February 2, 2007 IPCC report projects only a 28 to 43 centimeters (11 to 17 inches) rise in sea level.
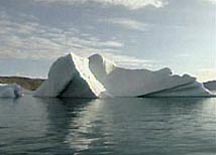
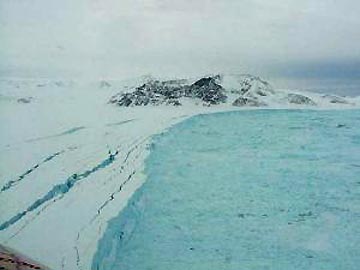
But scientists who have been studying glacier ice melt their entire careers are alarmed at recent increases in the rate of Greenland and Antarctic ice melt. This week I talked with Lonnie Thompson, Ph.D., Distinguished Professor of Geology at the School of Earth Sciences and a Research Scientist in the Byrd Polar Research Center at Ohio State University in Columbus. He thinks the worst case for sea level rise could be five times higher than the IPCC’s most conservative estimate.
Interviews:
Lonnie Thompson, Ph.D., Distinguished Professor of Geology, School of Earth Sciences; and Research Scientist, Byrd Polar Research Center, Ohio State University, Columbus, Ohio: “When you look at those numbers that the IPCC 2007 gives for increasing sea level, it’s like 5 inches to something like 23 inches. I think this is very much understating what we know already. And so I have problems with that.
I know a number of scientists around the world that complained about this being an inadequate number, based on what we know. You cannot ignore Greenland and Antarctica where we have most of the water stored in ice on land.
SO, DOES THAT MEAN THAT THE UNITED NATIONS HAS COME UNDER SOME POLITICAL PRESSURE TO BASICALLY FALSIFY DATA IN WHAT SHOULD BE A SCIENTIFIC REPORT?
(laughs) Well, that’s an interesting question. Unfortunately, IPCC is a science document, but also a political document. It has to be signed off by 154 countries, including the United States and oil-producing countries and so it tends to be conservative from that perspective. But I think on top of this is a lot of uncertainty about our knowledge of how these big ice sheets are actually going to respond to increased warming.
But what we do know is that over periods where we have observations and we now have satellite observations of these ice sheets that show changes due to the current climate are dramatic. There are quite likely to be some surprises as we go forward in an unfamiliar climate.
WHAT DO YOU THINK IS A FAIR ESTIMATE ABOUT WHAT THE SEA LEVEL RISE WILL BE BY 2100?
The thing I’ve been surprised by having spent my life and last 30 years on some 51 expeditions around the world is just how fast ice can respond to climate change. I think we have really under estimated the rates at which ice can disappear on land. When it disappears, that’s frozen water that makes its way to the rivers and into the oceans of the world and leads to global sea level rise.
Sea Level Rise Over Next 90 Years Could Be 55 Inches
IF YOU WERE MAKING AN EDUCATED GUESS, WHAT DO YOU THINK A FAIR ESTIMATE OF SEA LEVEL RISE WOULD BE IN THE NEXT 90 YEARS?
I find it more reasonable to look at numbers like in the order of 30 to 40 inches of sea level rise. We have to be prepared for more extreme changes because of the uncertainty and the surprises we’ve seen in the last five years in how fast ice can disintegrate.
WHAT DO YOU PERSONALLY THINK IS THE WORST CASE FOR THIS CENTURY IN TERMS OF SEA LEVEL RISE?
I think the worst case for sea level rise by the end of this century is up around 55 inches. I think that’s a possibility.
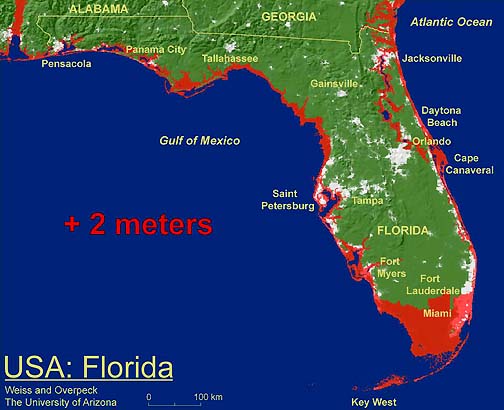
IF IT REACHES 55 INCHES, HOW MUCH OF FLORIDA WOULD BE GONE?
Well, we would looking at about one-third of Florida disappearing (under water).
A THIRD OF FLORIDA AND HOW MUCH OF THE GULF COAST?
That’s exactly what we are working on. I don’t have those numbers, but it would be significant. Of course, all that infrastructure – even places like New York City. The potential cost and impact of that kind of sea level rise is tremendous.
IT WOULD MEAN THAT NEW ORLEANS IS NOT AT ALL A PLACE THAT WOULD SURVIVE?
Exactly. In fact – these are why the projections are so important. Right now, we’re investing a lot of resources in rebuilding in New Orleans. The question is whether that’s money well spent?
IF WE’RE HEADED FOR A 55-INCH RISE WORST CASE – WHEN WOULD NEW ORLEANS, FLORIDA AND THE GULF COAST KNOW IT WAS NO LONGER POSSIBLE TO HAVE REAL ESTATE ALONG THE CURRENT COASTLINES?
I think they are already realizing in the really low areas like the Everglades. You’re right at sea level. The salt incursions that have been coming – and if you get an inch rise in sea level, you will displace the vegetation and animals a mile inland in those areas because you are right at sea level.
FOR EVERY INCH OF SEA LEVEL RISE, YOU ARE GOING TO HAVE A MILE OF INCURSION OF OCEAN WATER INLAND?
Yes. That affects the types of vegetation. When you look at the ecosystems, you go all the way from the salt-adapted vegetation along the coast to the fresh water vegetation as you go further into the Everglades. Those boundaries will shift as sea level rises.
WHEN YOU SAY IT MIGHT, AT WORST CASE, BE FIFTY-FIVE INCHES BY THE END OF THIS CENTURY, THOSE FIFTY-FIVE INCHES WOULD THEN TRANSLATE INTO 55 MILES INLAND?
That’s pretty much correct, yes, fifty-five inches could displace 55 miles inland. And how far it goes, depends on the topography, the elevations that you are looking at. But the change could be tremendous.
THAT’S WHY AT LEAST ONE-THIRD OF FLORIDA’S COAST COULD BE GONE AND MIAMI WOULD BE UNDER WATER?
Exactly.”
Carbon Dioxide Could Reach 800 ppmv By 2100
Today in 2007, the measured amount of carbon dioxide in the Earth’s atmosphere is 381 parts per million volume (ppmv). The last time it was at this level was between a million to 20 million years ago. But long before that nearly 300 million years ago in the Late Paleozoic, CO2 levels rose to 1,000 parts per million and higher. That’s when ice melted all over the planet. Then the CO2 levels went back down. Earth’s CO2 levels have been like a yo-yo, going up and down for millennia.
Scientists have learned that when CO2 levels fall, the Earth cools down and there have been many mini-ice ages. When CO2 levels rise, the Earth warms up, the ice melts and sea levels rise.
Late Paleozoic Research Indicates CO2 Can Yo-Yo, Causing Very Erratic Global Climate
One scientist who recently studied geological evidence from the Late Paleozoic era (305 million to 265 million years ago) reports that as CO2 levels increased from around the 381 parts per million volume that Earth has now in 2007 upward to 1,000 ppmv and higher, the world climate was highly erratic and very stormy. She is Isabel Montanez, Ph.D., Professor of Geology at the University of California-Davis. She and other researchers are concerned that since computer models indicate CO2 levels are now expected to double to around 800 ppm over the next 90 years, will the whole planet be challenged by increasingly erratic weather? If so, how many coastline populations will have to move? And how much Earth life will be forced into extinction?
[ Editor’s Note: The Paleozoic era lasted from about 540 to 250 million years ago, and is divided into six periods. The 320-odd million years of the Paleozoic era saw many important events, including the development of most invertebrate groups, life’s conquest of land, the evolution of fish, reptiles, insects, and vascular plants, the formation of the supercontinent of Pangea, and no less than two distinct ice ages. The Late Paleozoic also had an icy period that moved to intense global warming and was associated with CO2 levels that exceeded 1,000 ppmv. The earth rotated faster than it does today, so days were shorter. The moon was also closer, which produced stronger tides. During the middle and late Paleozoic (Devonian to Permian), about a third of the Gondwanan land mass (no continents then) was torn into small pieces and moved rapidly to equatorial regions. ]
Interview:
Isabel Montanez, Ph.D., Prof. of Geology, University of California – Davis, Department of Geology, Davis, California: “Various other studies and mine are all pointing at the same message: climate change does not come gradually. It comes with very erratic behavior.
We chose a period of time from about 300 million to 260 million years ago because it was the last time that the Earth had conditions very much like today. It was a time period that had ice at the poles, big continental ice sheets like we do. And it was a time period that had very low atmospheric greenhouse CO2 like we do today. It was also a time period when the Earth went to a completely different state where there was no ice. The ice completely melted and there were significantly higher levels of CO2. So, we were really interested in how that transition was made and what impact it had on climate and on Earth life.
Ancient Climate Was A Yo-Yo of CO2
What we found was that the transition was very strongly linked to the amount of CO2 in the atmosphere. I don’t think anyone disputes anymore that rising CO2 means warmer temperatures and changing climate. My study shows there is a direct link between CO2 levels and ancient global warming and cooling.
But rather than a gradual progression, CO2 went up and down and there was a much greater instability of climate. Temperatures on Earth and in the oceans also went up and down by several degrees. All the other climate behavior – the amount of rainfall, dry or not dry, windy – all those indicators also alternated very erratically. What this told us is that major climate transitions in the past have been associated with very unstable climate behavior.
Late Paleozoic and Earth Today – Both 381 ppmv Carbon Dioxide; Late Paleozoic Increased to Over 1,000 ppmv CO2
Now, for the future, the thing I think is important about the time period we studied is that the natural changes in CO2 from levels very much like today (381 ppmv) like we live in today to levels of more than 1,000 ppmv or 2,000 ppmv. I don’t know if we will go to those levels quite, but if we were to exhaust our fossil fuels, we could easily go to 1,000 ppmv, if not 2,000 ppmv.
These changes when we were looking at them happened over a long time period, 40 million years. It took literally hundreds of thousands of years and millions of years for changes to happen. But today, we’re looking at predicting levels of CO2 at about 500 ppmv by mid-century even; certainly by the end of the century when they could be even higher.
Burning Fossil Fuels Increases CO2 More Rapidly
There are those who say if we burn through our fossil fuels more aggressively or at the same rate as now, we’re going to reach 1,000 ppmv. But this is all happening at a much faster time period than in the past. This is happening in decades, a century, or century and a half.
The parallel between the ancient climate, now and our future is that we see such unstable climate in the past whenever CO2 goes up dramatically. So, we should expect that climate and life on Earth is going to respond just as erratically as CO2 continues to go up, but at a much faster rate than what we studied. That’s what the big uncertainty is. We really don’t know how to predict that. We don’t know how to model and predict future change when it can be erratic.
Paleozoic CO2 Rise: Volcanoes?
WHAT CAUSED THE CO2 TO RISE IN THE 40 MILLION YEARS THAT YOU STUDIED?
That is the million dollar question. The best guess is that there was a natural increase in volcanic activity, quite a bit of it. Part of the reason was that the continents were all colliding into one another. So that was certainly a source to cause CO2 to go up. That’s probably a pretty good connection there.
Why Did Paleozoic CO2 Yo-Yo?
What is not clear is why did it yo-yo? Why did it come back down and then go back up and yo-yo? It probably had a lot to do with tropical rainforests in the equatorial regions – really much larger than today’s rainforests. They probably did a good job of sweeping out a lot of the CO2 in the atmosphere, but clearly could not keep up with it. That might be the reason why things did yo-yo so much until eventually CO2 took over and got high and stayed high.
IF CO2 DID A YO-YO THEN, WHAT WAS THE WORST CASE OF ERRATIC WEATHER BEHAVIOR? WHAT MIGHT BE AHEAD FOR US NOW IN THIS COMPRESSED TIME OF 90 YEARS?
Exactly. Two things I would say. From my study there might be a direct parallel, because it seems like that window of 1,000 ppmv is what we might call a threshold. Ice might be stable below that level, but in our records when we hit 1,000 ppmv – whether CO2 was going up or down – that seems to be the stability point for the ice sheets to come back or to melt.
The other time period is when we actually developed our ice on Earth in the last 34 million years. That’s when we got Antarctica and then the northern hemisphere ice. If that 1,000 ppmv window is real, then it’s pretty scary. We could approach that.
We see temperature changes in the tropical oceans of 4 to 7 degrees Celsius. In the past on a short time scale, they too have seen changes of about 3 to 5 degrees Celsius change in the tropical oceans as well (warmer). That leads to a whole domino effect when you start to change the ocean temperatures so much.
Rapid Climate Change Causes Plant and Animal Extinctions
LOTS OF EXTINCTIONS?
Yeah, ultimately it can. No doubt about that. We see it in our records with the plants. But at first, what it does is if you change the temperatures of the oceans, you change the ocean circulation patterns. When you change the circulation, you also change the way the water interacts with the atmosphere. Ultimately, that also changes weather and climate, there can be much more storminess and increased temperatures in the air because the oceans are releasing their heat and even more sources of greenhouse gas. There can be accelerated warming even.
But when the circulation of the ocean changes, so does the climate – especially in places like northern Europe and Great Britain and Canada. They can really get cool quickly and kind of oscillate between very cold and very warm again. Anything that lives in those regions and can’t migrate at the rate to keep pace with the climate change? They have only one choice: extinction.
WHAT IS THE WORST CASE THAT COMES OUT OF YOUR RESEARCH IN TERMS OF HOW BAD THE WIND COULD BECOME, HURRICANES, TORRENTIAL RAINS? HOW BAD COULD IT BECOME IN JUST THE NEXT NINETY YEARS?
One of the things we see is when we reach periods of 1,000 ppmv carbon dioxide, the monsoon type climate intensifies dramatically. That’s because at the Paleozoic time there was a huge monsoon system, very much like those in Southeast Asia now – but much bigger scale. What that means is storminess. No doubt, when we hit that threshold when we start to lose some of the ice caps, it changes atmospheric circulation enough and makes the exposed continents much more capable of warming the atmosphere and you get increased storminess. No question about that.
Last Time Earth Had 382 ppmv Carbon Dioxide Level: Between 1 to 20 Million Years Ago
The 382 ppmv of CO2 that we have now are higher than we have seen in the last 20 million years. For certain, higher than we’ve seen in the last 600,000 years. So, already we are outside of the norm of basic stability of this planet. And with that increase beyond the norm, we’ve seen already a little warming – a half degree Celsius (1 degree F. in 20th Century). But we also know that those levels are going up. There is nothing we can do to stop it rising to at least 500 ppmv.
And if we do nothing to contain our energy uses, we’ll probably go to a doubling up to maybe 1,000 ppmv. We fully expect that with the increase in CO2, there is a parallel increase in warming – much more than the half degree Celsius we’ve already seen. With this warming is the ice issue: the instability of the ice.
A Very Different Earth in 2100? Where Will All Coastal Refugees Go?
BASED ON EVERYTHING YOU KNOW SO FAR, IF YOU WERE GOING TO MAKE AN EDUCATED VISUAL PICTURE FOR THE MODERN WORLD ABOUT WHAT THE EARTH WILL LOOK LIKE IN ANOTHER 90 YEARS, WHAT WOULD YOU THINK?
I think about that a lot, actually. I have two kids. But also academically and as a human in society. I think going to a seasonally ice-free Arctic is very reasonable. I think that’s going to happen. I don’t think we are going to escape that. That will inevitably affect ocean circulation. That means much of northern Europe and Great Britain are going to live the way they are living now. They won’t be able to. They will have very erratic, very stormy weather. That population will need to survive somewhere else and likely will demand migration to more southern locals.
Areas like the equatorial regions of the tropics and sub-tropics in developing countries like Africa, they will probably see much more drought. So, they, too will need to find alternative locations to grow their products and to live, as well as the Middle East. I think we will see places like India and Bangladesh, low lying areas that will see increased storminess. They will also have to deal with increased flooding and disasters of mega-monsoons.
So, the bottom line to me is: Where are we going to put as many people as we already have, plus the increasing population, in that much less inhabitable land on Earth?
Spread of Insects, Weeds and Diseases
Then there are issues like diseases. A lot of species will go extinct because they can’t migrate fast enough. But those who do migrate are usually insects because they can. That means disease-bearing insects such as malaria by mosquitoes. I think it could be potentially economically devastating.
North American Climate: “More Katrinas” and More Drought
WHAT DO YOU THINK IS GOING TO HAPPEN TO THE UNITED STATES AND CANADIAN CLIMATE?
The United States is strongly impacted. Mid latitudes of the Northern Hemisphere are going to see changes. But it changes by regions. For example, for us in California, we worry a lot about water resources as does the whole southwest because here in California, in particular, we are so dependent on snow pack. We move water around so much, so we impact a lot of people. We’ll see more droughts probably, as will the southwest.
I think for the mid-continent where we grow – the Bread Basket – they are predicted to have lower soil moisture, more drought, certainly earlier growing seasons and later frosts. But that in itself can have a bad impact.
The East Coast might become wetter and stormier, but warmer. Milder winters, which isn’t always a good thing because of how earth life is adapted.
Then clearly the Gulf and southern Atlantic region of the U. S. is an issue because of hurricanes. Hurricane seasons will be longer-lived and probably much more intense.
When we do have hurricanes, the idea that they could be Class 5 with 200 mph winds is very feasible and they could be more frequent.
MORE KATRINAS?
Oh, more Katrinas. The modeling predicts there should be more Katrinas.
Worst Case by 2100?
Definitely sea surface temperatures in the tropics can change. That’s important in that we did not think that was the case. We thought the tropics were pretty buffered – that that was a part of the Earth which remained stable. It’s not so stable. It can get warmer by more than we thought. That’s not good because when that happens, a whole lot of other things happen in response and hurricanes happen more often. The circulation of the ocean changes.
The other thing is that we looked at the vegetation in the tropics. There were remarkably large migrations of rainforest-type plants – the ones that would normally live in our tropical regions today. They like it wet and warm. They migrated very far distances. We don’t know how much, but minimally tens to hundreds of kilometers. In their place, when global warming came on and the ice disappeared and CO2 went up, in their place came the opportunists from the dry land plants. Those were the conifers and ancient pines, but today are shrub lands and weeds. These are opportunists and can live in very severe climate. But we don’t live off of them and they don’t do the beneficial things that the rainforest can do.
Could Rainforests Die Out?
Another thing the rainforests do that very few people appreciate is that the tropics is the sink for a lot of atmospheric CO2. The lush vegetation takes out quite a lot of CO2 from the atmosphere. If you don’t have that photosynthesis going on, there’s that much more CO2 you keep in the atmosphere.
IF I HAVE UNDERSTOOD CORRECTLY, 90 YEARS FROM NOW IF THE CO2 CONTINUES TO RISE ALONG WITH THE AVERAGE GLOBAL TEMPERATURE, THE GIGANTIC EQUATORIAL RAINFORESTS MIGHT EVEN BE DEAD?
Very possible. I have actually said to my colleagues when I wonder what will my kids be thinking when they are grandparents. I don’t know that they will have rainforests. I think the tropics will look very different, in part to accommodate all the people who will have to move to different areas. But also because I don’t think the rainforests will survive this coming change.”
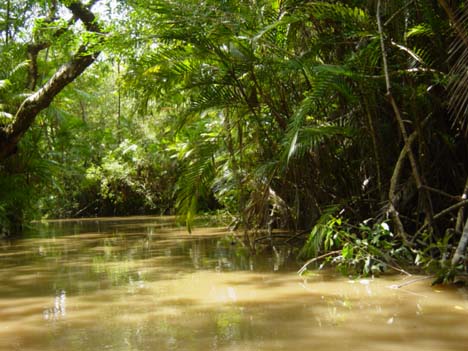
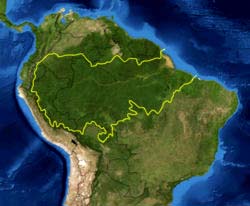
[ Editor’s Note: Wikipedia – “The Amazon Rainforest is a moist broadleaf forest in the Amazon Basin of South America. The area, also known as Amazonia or the Amazon Basin, encompasses seven million kilometers (1.2 billion acres), though the forest itself occupies some 5.5 million kilometers, located within eight nations: Brazil (with 60 percent of the rainforest), Colombia, Peru, Venezuela, Ecuador, Bolivia, Guyana, Suriname, and French Guiana. The Amazon rainforest represents over half of the Earth’s remaining rainforests and comprises the largest and most species-rich tract of tropical rainforest in the world. ]
More Information:
For further information about global warming and glacier ice melts around the world, please see reports below in the Earthfiles Archives.
- 01/10/2007 — 2006: USA’s Warmest Year On Record
- 12/07/2006 — Earth Headed for Warmest Period in 55 Million Years?
- 11/09/2006 — Outer Space Sunshade to Cool Earth in Global Warming?
- 09/09/2006 — Methane – Another Threat in Global Warming
- 07/18/2006 — 2006 – Hottest Year So Far in U. S. History
- 06/24/2006 — “High Confidence” Earth Is Warmest in 400 Years – Maybe Even 2,000 Years
- 03/17/2006 — Planet Earth’s Ice Melt
- 11/18/2005 — Is the Sun Heating Up?
- 09/23/2005 — Phenomenon of “Instant” Hurricanes in 2005
- 05/11/2005 — Greenland Sea Cold Water Re-Cycling Has Nearly Stopped. Britain Expected to Become Cooler.
- 05/07/2005 — Did Milky Way Gas and Dust Turn Earth Into Icy Snowball Four Times?
- 05/03/2005 — Part 2: Japan Air Lines Pilot Interview About November 1986 UFO Encounter
- 02/26/2005 — Collapse of Societies: From Easter Island to Iraq – to Western World?
- 02/11/2005 — Sunspot Region 720 Emitted Strongest Solar Radiation Since October 1989.
- 04/01/2005 — What’s Killing Off Marine Life Every 62 Million Years?
- 02/03/2005 — Kyoto Protocol Goes Into Effect February 16, 2005. British Scientists Warn Global Temperatures Could Climb Higher Than Earlier Estimates.
- 01/03/2005 — Audience Feedback About Abrupt Climate Change 5,200 Years Ago and Mayan and Aztec Calendar Links
- 12/31/2004 — Abrupt Climate Change Occurred Worldwide 5,200 Years Ago.
- 10/15/2004 — Ever-Increasing Carbon Dioxide Build-Up in Atmosphere Since 1958
- 08/27/2004 — Global Warming Impact On Birds – More Extinctions Expected
- 02/27/2004 — Abrupt Climate Change: Scenario from A Pentagon-Commissioned Report
- 11/29/2003 — Glaciers Are Melting Around the World So Fast That Water Supplies Could Be Threatened
- 12/14/2002 — Arctic Rivers’ Fresh Water Flows Could Change Atlantic Ocean Current
- 10/21/2002 — Mt. Kilimanjaro’s Ice Cap Is Melting Fast
- 03/21/2002 — Antarctic Peninsula Is Melting – And So Is Arctic Ice
- 02/13/2002 — January 2002 Warmest On Record For Whole World
- 01/30/2002 — Latest Satellite Data Shows Surprisingly Thicker Ross Ice Shelf in Antarctica
- 12/22/2001 — Scientists Warn That Climate and Earth Life Can Change Rapidly
- 03/04/2001 — Disappearing Glaciers – Evidence of A Rapidly Warming Earth
- 02/07/2001 — 94% Decline In Aleutian Islands Sea Otter Population
- 01/28/2001 — U. N. Global Warming Forecast: Up to 10.5 Degrees F. Hotter At End of 21st Century
- 10/01/2000 — A Search for Earth’s First Life
- 04/20/2000 — Severe Arctic Ozone Loss and Deep Ocean Warming
- 12/25/1999 — Y2K Nuclear Concern and Global Warming Update
- 09/26/1999 — Could Ancient Microbes in Polar Ice Cause Epidemics?
- 05/27/1999 — Amphibian Decline – Parasites and Increased UV Radiation
- 05/05/1999 — Two Antarctic Ice Shelves Almost Gone
Websites:
Sea Level Rise Map Projections
Byrd Polar Research Center, OSU: http://researchnews.osu.edu/archive/lonthmppics.htm
http://researchnews.osu.edu/archive/glacgonepics.htm
Glaciers and Ice Sheets: http://www.solcomhouse.com/icecap.htm
National Climate Data Center (NCDC): http://www.ncdc.noaa.gov/paleo/
National Snow and Ice Data Center: http://nsidc.org
© 1998 - 2024 by Linda Moulton Howe.
All Rights Reserved.