
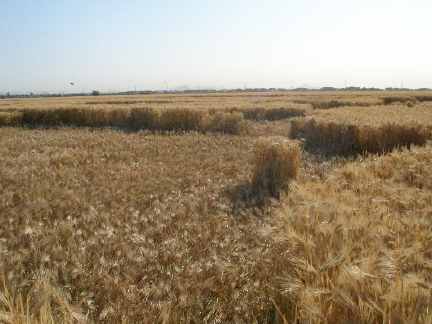
April 12, 2007 Chandler, Arizona – The first unusual downed crop in the 2007 American season was discovered on March 25, 2007, by Michael A. Polani, a resident of Chandler, Arizona. It is very similar to the first American cases of randomly downed crop I investigated fifteen years ago in the neighbor communities of Linfield and Limerick, Pennsylvania, where odd patterns were found in different fields on May 24, 1992.
The young Pennsylvania wheat had long, straight sections that were scalloped along the edges as if a pulsing energy had layed down the plants with methodical precision. Some sections of the flattened crop were parted neatly like hair, with each side going in opposite directions.
There were also woven layers of overlapping 90-degree angles. As strange as it was, pilots flying over said it must be wind damage. But according to a Ursinus College scientist back in 1992 who collected plants for study, he found stems bending at angles from growth nodes as Biophysicist Levengood would also report over the following years from crop formations all over the world. “Not wind damage,” the scientists concluded.
Then in May 2005, a farmer in the Phoenix, Arizona, suburb of Tolleson, found three of his barley fields affected by plants flattened in staight pathways about 600 feet long, parallel to the power lines and road edging his fields. Biophysicist Levengood’s analysis of the Tolleson “randomly downed” barley confirmed the same biochemical and biophysical changes he had seen in more dramatic geometric crop formations. [ See: 0505Earthfiles.]
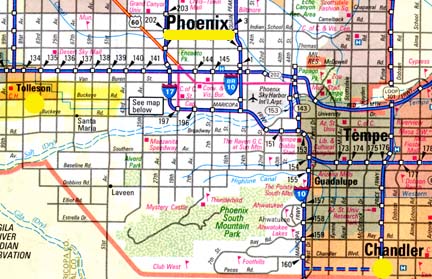
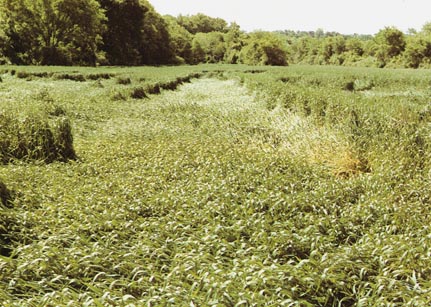
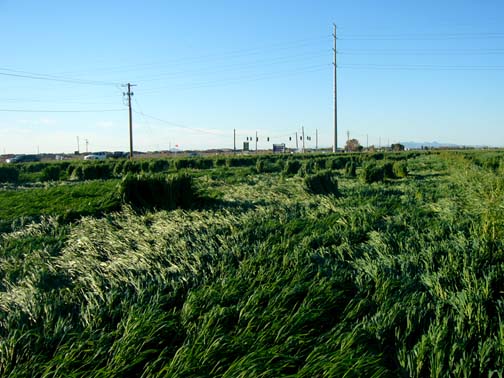
Tolleson is west of Phoenix. Now, the latest unusual downed plants were discovered southeast of Phoenix in the suburb of Chandler on March 25, 2007. Michael Polani took many good photographs, which were forwarded to Jeffrey Wilson, Director of the Independent Crop Circle Research Association (ICCRA) in Ohio. When Jeff sent me an email with the photographs, I immediately thought of the unusual Linfield and Limerick, Pennsylvania, and Tolleson, Arizona, fields. In all three, the standing crop has pulsing, wavy edges on long stretches of downed plants. In this new Chandler case, the farmer has still not been located and the exact identity of the crop is unknown. But it might be a sorghum or Sudan grass grown as ground cover or low-grade animal feed.
Whatever the crop is, the wavy, pulsing edges signify that something extraordinary happened that is not characteristic of normal wind damage. I talked with Jeff Wilson about the anomalous features in this first American “randomly downed” crop formation of the 2007 season.
Interview:
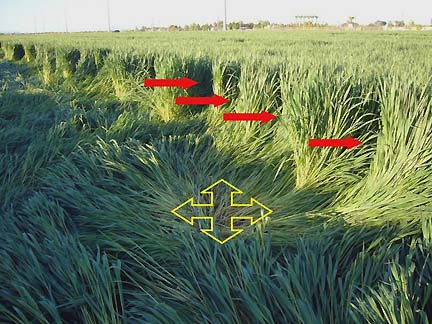
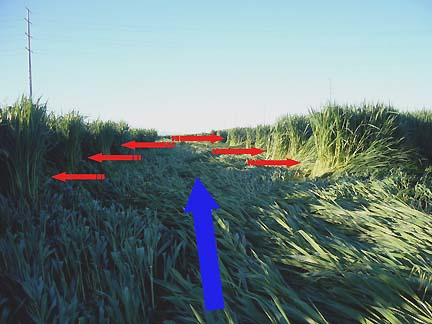
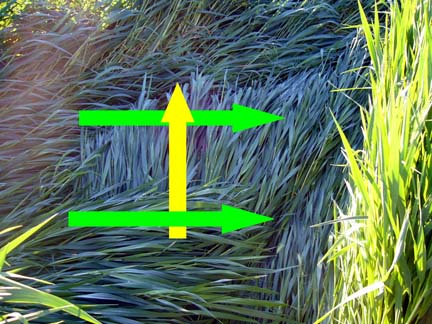
Jeffrey Wilson, Director, Independent Crop Circle Research Association (ICCRA), Williamsburg, Ohio: “The effect that’s left behind by whatever is making the plants go down is that it leaves signs of a wave-like effect. You’re looking down a very long, extended, straight, flattened pathway. On either side of the flattened crop where the standing crop is, you essentially have a regular indentation every two to three feet going into the standing stalks, which seem to be perpendicular to the general flow of the plants that are flattened in a straight line. We’ve seen this type of wave-like flattening in the standing edge of the crop right adjacent to the flattened stuff in several randomly down type of formations in the past.
You mentioned Limerick, Pennsylvania, case. That goes all the way back to May 1992. A couple more recent ones: there was the Tolleson, Arizona, one that was in barley from May of 2005. And also Carmichael’s, Green County, Pennsylvania, that was late June 2005, where we had these straight lines in the crop, but also exhibiting this wave-like effect.
The most recent one we saw last year on April 22, 2006, in Fairfax, Ohio, where there was another example of the wave-like pattern in the standing edge.
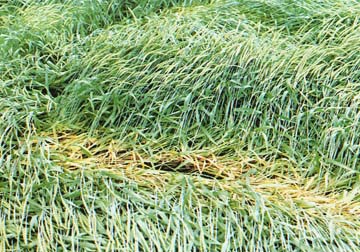
WHICH I’VE ALWAYS REFERRED TO AS THE PULSING EDGE BECAUSE IT IS SO REGULAR. I ALSO ASSOCIATE THE PULSING, OR WAVE, EDGE WITH 90-DEGREE ANGLED WOVEN SECTIONS ALSO IN THE SO-CALLED ‘RANDOMLY DOWNED’ CROP FORMATIONS. THERE IS ALSO THIS CROSS-WEAVE 90-DEGREE ANGLE OF THESE (CHANDLER, ARIZONA) PLANTS IN THE PART THAT IS FLATTENED.
Yes, Michael Polani – in one of the photographs he took – shows very clearly the flattening at 90-degree angles to each other and creating a three-layer weave, at least in one section.
This 90-degree effect we’ve now seen in several cases, including the Fairfax, Ohio, from last year and the Carmichael’s, Pennsylvania, one from 2005, in which there were small, rectangular square sections flattened first in one direction and then perpendicular to that one there is another small square section and then another one and another one which creates what we call a ‘checkerboard’ effect being flattened in these long linear pathways.
IS THERE ANY OF THIS THAT YOU THINK COULD FALL INTO A METEOROLOGICAL PHENOMENON CATEGORY?
That’s a good question. We don’t have any information about when this formation in Chandler took place. We don’t know if there was any weather involved or wind involved. But certainly, the effects left behind match up very well with other randomly downed formations that we’ve looked at in years past.
IF IT’S NOT METEOROLOGICAL, WHAT COULD DO THESE PATTERNS WITH THAT PULSING, WAVE EDGE, WITH THE 90-DEGREE WOVEN FLAT AREAS?
Yes, that’s still the big question! That’s why we’re still looking at crop circles. I will say that this particular location (Chandler, Arizona) has many of the same contextual features surrounding it that we find in a lot of other crop circle formation cases, both geometrical and non-geometrical – in the sense that it was adjacent to power lines. The closest power line had a transformer box on it. It was the lowest section of the area. This area is very flat, but Michael Polani told me that this field, in particular, is about four feet lower than all the adjacent properties.
Why Phoenix?
Now, this is in Arizona and you think it’s very dry there and it is. One of the things we find is that crop circle formations are coming down very close to water. In this (Chandler) case, it turns out that the whole length of the field is bordered on two sides by one of the canals that is filled with water right now. That canal actually dates back to prehistoric times. That was one of the ancient Hohokam canals that was built maybe 2,000 years ago. That kind of feature seems to be one of the things that we find – that these crop circle formations are coming down near old, ancient archaeological sites. This (Chandler) seems to have all the same contextual features surrounding it that all the other crop circles seem to have.

[ Editor’s Note: The term denotes the culture of the ancient agricultural populations, which inhabited the Salt and Gila river valleys of Southern Arizona around 300 to 1200 A. D. The Hohokam are noted for their extensive irrigation systems, with canals over 10 miles long that channeled water to agricultural fields in an otherwise arid and inhospitable environment. Many architectural features of Hohokam settlements, including sunken ball-courts and pyramidal mounds, are similar to structures found in central Mexico. The Hohokam maintained extensive trade connections with groups further south, leading to speculation that the Hohokam settlements were founded by Mesoamerican migrants. Debate persists regarding the fate of the Hohokam – was it drought or some other environmental change which caused their demise? The region was also inhabited by the Pima and Papago, but it is not clear if the Hohokam were ancestral to either group.
See: E. W. Haury, The Hohokam © 1976. ]
Hohokam Indian Ancient Sites Near Phoenix
Not only did the Hohokam people fill the enormous canal structures, which allowed them to become some of the first farmers in North America, but they also built very large pyramids that are called ‘platform mounds’ – flat top pyramids and large pueblo villages, many of which are found throughout the Phoenix area and an enormous concentration to the northeast of Phoenix. The closest of these to the Chandler formation is not very far away. It’s called the Hokoman Pima National Monument. The U. S. National Park Service does not allow people to go out there, but it is relatively close and they don’t allow people to go out there in order to protect those archaeological sites.
SO, IN THIS MODERN DAY OF 2007 WHEN WE DON’T THINK OF PHOENIX AS BEING A PLACE OF ANCIENT SITES, IT REALLY IS. I WAS GOING TO ASK YOU IF YOU HAD ANY SPECULATION ABOUT WHY THIS PHENOMENON IN ALL OF ITS MYSTERY MIGHT CHOOSE THE PHOENIX, ARIZONA, REGION TO PUT DOWN EARLY PATTERNS IN THE UNITED STATES?
We have a very long, extended growing season. Crop circles need to have crops to come down in, so this is where there are crops right now in the United States. So, early on we see things in Arizona and the most recent geometric pattern that’s happened in North America happened in December 2006, in Mexico, two hundred miles to the south. So, we see crop circles throughout the whole year across the North American continent.
December 2006 Crop Circles in Mexico
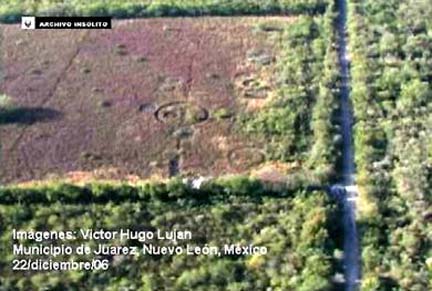
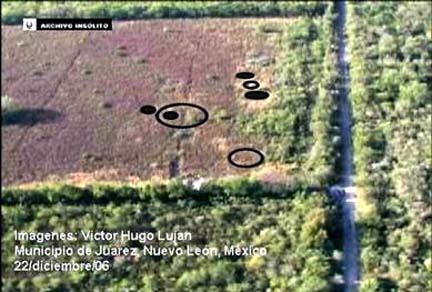
Jeffrey Wilson at ICCRA reported on January 28, 2007: “This geometric formation was discovered about 14 miles east of Monterrey, Mexico in the village of Juárez in the Mexican state of Nuevo León. The local channel 7, TV Azteca Norreste, had sent out their helicopter “Angel 7” to get some video footage of a traffic accident on December 22, 2006. They were in-flight, returning, when the cameraman, Victor Hugo Lujan, spotted several circular marks in a pasture. While still airborne, they quickly transmitted and broadcast live coverage of the crop circle formation to their TV audience.
“Local police were notified of the formation, and they cordoned off the site to protect it from visitors and to investigate – no further details have emerged from this police investigation as of yet.
“The formation consists of four flattened circles and three flattened rings of various sizes and placement across the field (perhaps there may be more circles there, as the quality of the video capture from the TV broadcast isn’t particularly good), as well as at least one area of RDF-type flattening.”
DO YOU HAVE ANY INTUITIVE SENSE IN YOUR EXPOSURE TO SO MANY PATTERNS OVER THE YEARS ABOUT WHAT THE LINK MIGHT BE BETWEEN A VERY ANCIENT INTELLIGENCE THAT KNOWS A GREAT DEAL ABAOUT THE EARTH AND WHAT WE ARE CALLING THE MODERN ERA OF CROP FORMATIONS GLOBALLY?
That’s a very difficult question to answer. I don’t think we really know the full extent of any connection of that right now. However, there does appear to be this correlation very strongly between where crop circles are being reported and finding these ancient sites across North America. The number we have in our ICCRA data base is somewhere between 60% and 70% of the crop circles being reported are coming down in very close proximity to these ancient archaeological sites.”
Global Warming and Crop Formations: Life is not guaranteed?
By the late 1990s, researchers who had followed the mystery for several years were speculating more about crop circle makers being from other dimensions, parallel universes and time travelers. But why would crop fields be the medium? And why so widespread in England, France, the Czech Republic, Poland, Germany, the Netherlands, Spain, Italy, Japan, Australia, Russia, Peru, Canada, Mexico, the United States and other countries?
Biophysicist W. C. Levengood who has studied so many crop formation plants and soils hypothesizes that spinning plasma vortices are involved with crop circle creations. But what unidentified trigger provokes the spinning plasmas? Could low energy plasmas with microwave frequencies produce the physical impacts on soil and plants and leave images of mysterious lights and spheres on videotapes and photographs? Are the mysterious lights so often associated with crop formations an unidentified natural phenomenon? Or could they be plasmas supervised by an advanced intelligence which humans have yet to encounter. Could the mysterious lights and crop circles be connected to the same ancient intelligence which inspired other marks around the world in ziggurats, pyramids, mounds and stone circles?
In addition to the mysteries about how the complex crop formations are created, there is always the question of why? Do the often geometric patterns contain a mathematical language? If so, has Something over the past two decades been trying to warn us that life on Earth is not guaranteed and that great changes are upon us in global warming, rising sea levels, expanding droughts, intensifying storms and hurricanes, threats to food production and increasing extinctions in earth life which cannot adapt to the speed in which ecosystems are changing? Drowning polar bears are an example.
Even the U. S. Supreme Court decided in the first week of April 2007, in a 5 to 4 vote, that the Environmental Protection Agency has an obligation to regulate greenhouse gases from automobiles and industries as global warming threatens the security of Earth life in the decades to come.
A few days later on April 6, 2007, the U. N.’s Intergovernmental Panel on Climate Change issued another report about the consequences of global warming in the Earth’s future. Here is a short and sobering list of some expected outcomes:
– One-quarter of Africa’s billion people will lose most of their water supplies
– Food production will fall by half in many countries
– Sea level rise by a meter or more will force millions of coastal residents to move inland, provoking unimaginable refugee and political crises.
– North America will suffer more intense hurricanes, floods, droughts, heat waves, and wildfires.
Before the IPCC report was released April 6, scientists were complaining that the facts and computer projections would be watered down. One of the scientists who contributed to the report is Stephen Schneider, Professor of Biological Sciences and Interdisciplinary Environmental Studies at Stanford University. Professor Schneider has been studying the Earth’s climate since 1971. I asked him if he thought the IPCC report was watered down.
Interview:
Stephen Schneider, Ph.D., Prof. of Biological Sciences and Interdisciplinary Environmental Studies, Stanford University, Palo Alto, California: “There is always a typical propensity to find the components of an event that are lurid. And at the event I was at last week (IPCCC report meeting), there were components of the events that were lurid! You can find them. But the truth is that about 85% of the document really was at least as good or – in some cases improved – by the interventions of the governments.
We ran into trouble on two or three and I won’t deny that for fairly significant components of the report, that a few nations chose to refuse to cooperate on. I guess they thought it was an iconic threat against their own interests and when you are in the U. N. system, it’s by consensus. Consensus means everybody. If two countries say, ‘No!’ The system is blocked.
If the scientists say what they want to do is scientifically inaccurate, the system is blocked. Then you go into what we call ‘contact groups’ face-to-face and you resolve the language. Even the contact groups could not resolve the language. That’s very unusual. And there were a couple of issues that got watered down.
WHICH COUNTRIES GAVE THE BIGGEST RESISTANCE?
One has done it every single time since the IPCC began and that’s Saudi Arabia. Is anybody surprised? Why would they want to have a report that discusses the seriousness of a problem created by the burning of their primary export product: oil? So, it’s not a surprise.
And they play the game very honestly. They say, ‘This language is not acceptable to our delegation. They don’t even pretend to use scientific arguments. They just refuse.
China, on the other hand, which up to now has generally been occasionally suspicious, but by and large a pretty good player. But now, China just over and over and over blocked – but they used a different tact. That’s what got many of the lead authors angry. The Chinese said their own experts found what a particular lead author said was not scientifically accurate. They produced no such experts. They did not give the nature of the details. They just asserted it and when challenged, they stiffened their back and said, ‘We’re not going to vote for it.’
That lead to a pretty angry outburst because scientists are not the type to be told by somebody whose power comes from being a government person, ‘You’re wrong and you’re wrong scientifically, but I won’t tell you how and I have the power to block you.
So a lot of people were pretty angry about that. Now, they didn’t do this in every paragraph, or we would not have had a report. They only did it four or five times, but they certainly picked important items and it was very difficult to get a compromise from either the Chinese or the Saudis.
Once or twice, the United States did it. I was not very happy about that, but 80 times the U. S. was cooperative. Three or four times, I thought they were really making kind of ridiculous – in one case legalistic and in another inappropriate ways – which slightly weakened the IPCC report. But the U. S. was a very minor offender and on balance, they were much more positive than negative. That surprised me, considering the history of the Bush administration dealing with the blockade of their own government scientists from talking to the media. You know, government scientists in climate change (research) have been forced to have all their media questions bounced over to the public relations people. That’s been going on for years and finally, this 2007 Congress being of the other party is having hearing after hearing and smashing them (Bush administration) on this behavior. So, at this IPCC meeting, we had kind of expected that. But I was very pleasantly surprised that the U. S. was an overall positive force at the meeting, although once or twice, were not.
WHAT WERE THE STICKING POINTS SPECIFICALLY FOR CHINA AND THE UNITED STATES?
The U. S. removed some language in a table about the long-term commitment to sea level rise if we start melting the Greenland ice sheet on the grounds that it was too speculative. Now, it is speculative (about how much Greenland ice will melt over what time period). But it was labeled as speculative. And the probability that your house or mine will burn down is about 1%, yet everyone of us has fire insurance.
We’re talking about the planetary life support system of the planet with a probability of more than 1% of a potential de-glaciation of major ice sheets and a thousand year commitment to ten or more feet of sea level rise. That’s not a trivial issue! Just because it’s speculative does not mean it should have been removed. It was removed because it was dramatic and the United States did not want a dramatic statement in there. We disagree with the U. S. on that, but of course if the U. S. had supported it, it would have been blocked by the Chinese and Saudis anyway.
There was another even more important item where in this table I’m talking about – the one which had listed as a function of how warm it is. So we had 1, 2, 3, 4, 5 degrees Celsius warming (about 3 to 10.5 degrees Fahrenheit). Of course, nobody knows how much it will be warming because we would have to know how many people will be in the world, what standards of living they will demand and what technologies we use. And those are social assumptions about how the world will be organized. Plus, there were other uncertainties having to do with the climate itself.
So, what we wanted to do to try to give people a guide is underneath each of these headings of how much warming there might be, was a block of text, words like:
– Up to 10% of species threatened.
– 10% to 14% of species threatened with extinction.
And as you get warmer, of course, it gets more intense:
– Greater than 40% of species are at extreme risk of extinction if you go above 4 degrees Celsius warming.
So, that’s how the table is constructed:
– Up to 1 to 2 degrees C., crop yields improve in higher latitudes because of longer growing seasons.
– After 3 degrees C., crop yields decrease everywhere and even at 1 to 2 degrees C., crop yields are already declining in the hot and poor countries.
All of those factors were there and what we wanted to do was show the world how much does it take to warm up 1 to 3 degrees C. So we put above the table a time line for 2020, 2050 and 2080 with a wide range of warming associated with greenhouse gas emissions from very high to very low. That way people would see that if we had policy to eliminate some of the emissions, it would make a difference in lowering risks. And the U. S. was very supportive of leaving that in and we were very proud of them for that. So, on the really big issue, they were on the right side.
But the Chinese and the Saudis were their usual blocking selves on that one and we could not get it in the report.
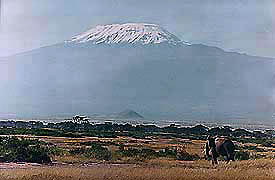
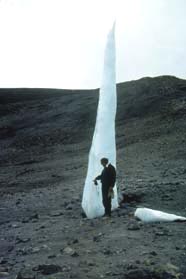
I CANNOT HELP THINKING THAT MT. KILIMANJARO WILL PROBABLY NOT HAVE ANY SNOW AND ICE BY 2009 OR 2010. THAT MEANS THAT A MOUNTAIN IN WHICH THE GLACIERS HAS HELPED FEED THE WATER FOR THE MILLIONS OF PEOPLE WHO LIVE THERE – THAT JUST IN THE NEXT FIVE YEARS IN ONE PART OF AFRICA, WE’RE GOING TO BE FACING WATER SHORTAGES ALREADY BECAUSE OF GLOBAL WARMING.
“One metaphor is a super tanker headed for the rocks. Just remember the one thing about super tankers: they turn very slowly and they have very bad brakes. That’s why I said we should have started 25 years ago (trying to reduce greenhouse emissions).
Another favorite metaphor is that you’re in a school bus – because it’s the kids now and into the future that’s going to get the worst of this – and it’s going down a steep hill with pretty iffy brakes. When they start getting hot, they stop working. What do they say? ‘So far, so good.’
IS IT POSSIBLE THAT WE ALREADY HAVE PASSED THE POINT OF NO RETURN AS THE EARTH BECOMES WARMER AND WARMER AND THERE IS NOTHING THAT HUMANS CAN DO?
No, I don’t think that’s the case. I have never been a catastrophist in that regard. Earth is not going to become Venus from anything that humans are going to do. We’re just going to make it pretty miserable for us and other species, but very differentially around the world. Don’t be a poor person in a hot country. Don’t live in hurricane alley.
Some world areas won’t be severely harmed for many decades. Others are being harmed already. So, it’s a patchwork quilt that is very uneven. As a result of that, not everybody suffers equally. Then you have a hard time getting the political accommodation and cooperation that we need because a lot of people perceive themselves as not particularly vulnerable. So, why should they give up their SUV?”
If viewers have more information about other crop formations in your area, please email me at [email protected].
See May 1, 2007 Earthfiles for scientific analyses of Chandler formation.
More Information:
For further information about American and other crop formations, please see reports below in the Earthfiles Archives and my book, Mysterious Lights and Crop Circles in the Earthfiles Shop:
- 06/11/2006 — Updated: Two Mysterious Circles in Wheat Baffle Kansas Farmer
- 09/02/2005 — Part 1: New York and Ohio Corn Circles “Flattened 2 to 5 Feet Above Ground”
- 08/02/2005 — Part 1: Anomalies Confirmed in Pennsylvania and Arizona Randomly Downed Crops
- 07/23/2005 — Mystery of Six Grass Circle Formations in North Carolina
- 05/26/2005 — Phoenix Barley Mystery: Apparently Irrigation and Wind
- 05/09/2005 — Mysterious Lights and 2003 Serpent Mound Soybean Formation
- 04/20/2005 — Outer Space Impact At Serpent Mound, Ohio, 256 Million Years Ago
- 10/17/2004 — American Crop Formations: 1880-2004
- 09/22/2004 — Miamisburg and Serpent Mound, Ohio Crop Formations: Geometries Compared
- 09/17/2004 — Updated: Part 1 – High Strangeness in Canadian Cattle Corn
- 09/12/2004 — Part 2 – High Strangeness in Canadian Cattle Corn
- 09/10/2004 — Update on Miamisburg, Ohio, Corn Pictogram – Balls of Light?
- 09/05/2004 — Part 2 – Hillsboro, Ohio Corn Plant Anomalies
- 09/04/2004 — Hillsboro, Ohio Corn Formation – High Strangeness in Soil and Plants
- 09/02/2004 — Updated Photos: Big, Impressive New Corn Formation in Miamisburg, Ohio
- 08/09/2004 — Pictograms in Poland
- 07/25/2004 — 2004 Canadian Crop Formations: Scorched Soybeans and “Dirt” Pattern in Barley
- 07/24/2004 — Part 3 – Crop Formations and Mysterious Lights in Wiltshire, England, July 2004
- 07/06/2004 — Mysteriously Downed Oat Plants in Eagle Grove, Iowa; Downed Corn in Hillsboro, Ohio
- 04/08/2004 — FBI Is Investigating Animal Deaths in Johnston County, North Carolina
- 11/01/2003 — Another Soybean Formation in Ohio
- 10/10/2003 — Updated – Ohio Hunter’s “Deer Camera” Photographs Mysterious Glowing Disk
- 10/05/2003 — Part 3 – Paint Creek Island, Ohio Crop Formation Photographs
- 10/03/2003 — Part 2 – Military Interest in Serpent Mound and Seip Mound Formations?
- 10/02/2003 — Part 1 – Another Soybean Formation Near Seip Mound in Ohio
- 09/12/2003 — 2nd Ohio Soybean Crop Formation is Manmade. USAF Investigation Unit Involved?
- 09/06/2003 — Part 2 – Unusual Soybean Formation Near Serpent Mound, Ohio
- 09/05/2003 — Part 1 – Unusual Soybean Formation Near Serpent Mound, Ohio
- 11/30/1999 — A New Crop Formation In Marion, New York and Crop Research Updates
- 09/05/1999 — Delphos, Kansas Ring Mystery – More Analyses
Websites:
Hohokam Indians: http://www.cavecreekmuseum.org/hohokam_of_the_southwest.htm
American Crop Circles, ICCRA: http://www.cropcirclenews.com/
English Crop Circles, Current and Archived: http://www.cropcircleconnector.com
Canadian Crop Circles, CCCRN: http://www.cccrn.ca/
German Crop Circles: http://www.kornkreise-forschung.de
Dutch Crop Circles, DCCA: http://www.dcca.nl
http://www.lucypringle.co.uk
http://www.members.iinet.net.au/~bwratten/ccc.html
http://www.cropcircleresearch.com
http://www.CropCircleAnswers.com
http://www.ukcropcircles.co.uk/?page=home
http://www.temporarytemples.co.uk
© 1998 - 2024 by Linda Moulton Howe.
All Rights Reserved.