
“If we look at the changes in the Arctic we’ve been talking about, we’ve just been flabbergasted at the rapidity of the changes.”
– Mark Serreze, Ph.D., National Snow and Ice Data Center
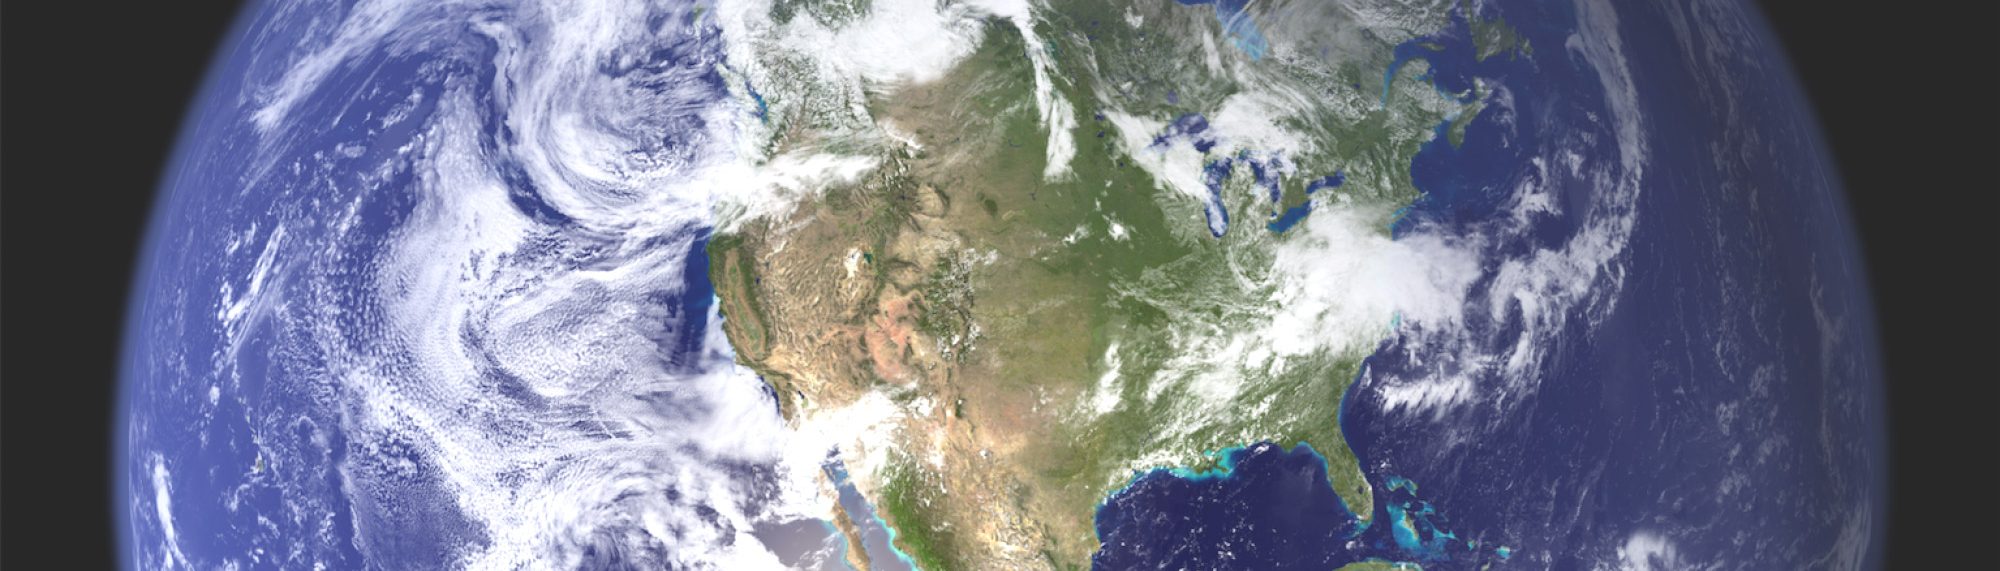
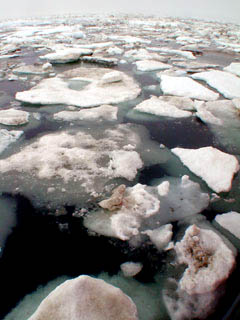
September 29, 2005 Boulder, Colorado – One increasingly important subject for everyone on Earth is global warming and the consequence of more intense storms in some regions, growing drought in others and the rapid melting of ice from mountain glaciers and the Antarctic which cause sea level rise.
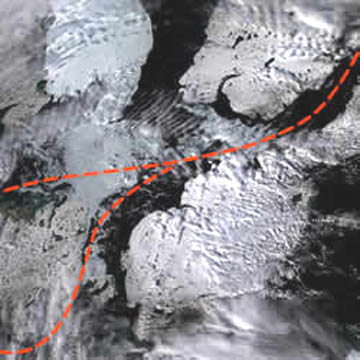
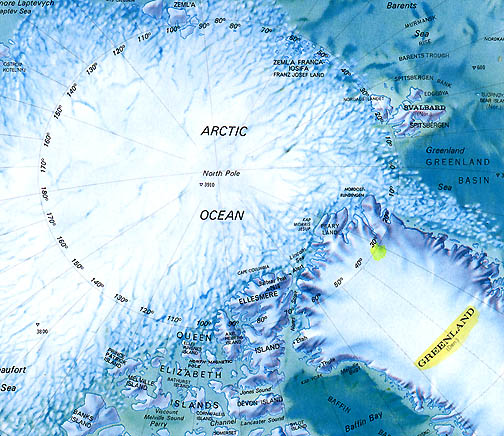
Now this week comes news from NASA and the National Snow and Ice Data Center at the University of Colorado, that the Arctic ice which floats at the North Pole melted to its smallest size – ever! – in records going back for at least a century.
Since the big north polar cap ice floats, its melting does not contribute to sea level rise. But why it’s melting so much is directly linked to global warming and an annual trend toward warmer temperatures in the Arctic. Permafrost is melting, roads are buckling, houses are sinking and polar bears are faced with extinction, since those mighty animals work from the ice to feed off fish and seals. This summer of 2005, so much Arctic ice melted that ships could travel through both the North East and North West passages. Based on the hard data of water and air temperatures that continue to rise each summer, current computer models for the Arctic indicate that there will be no ice at all during Arctic summers in another sixty years, around 2070. Some scientists even wonder if the Arctic ice melt is happening so rapidly that the hands on the computer clock have to be moved back, maybe to only three or four decades from now.
This week I talked with Mark Serreze, Ph.D., about the persistent and increasing Arctic summer ice melt, especially the trend established in the past four years. Dr. Serreze has been a research scientist for fifteen years at the National Snow and Ice Data Center at the University of Colorado in Boulder.
Interview:
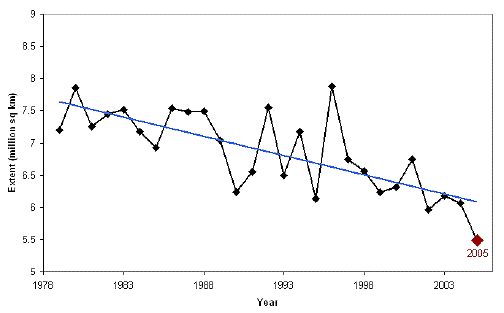
Mark Serreze, Ph.D., Research Scientist, National Snow and Ice Data Center, CIRES, University of Colorado, Boulder, Colorado: “In the past four years, that downward trend has radically accelerated: 2002, 2003, 2004 as well as 2005 we saw extreme losses of Arctic sea ice cover. It turns out that 2005 sets a new record in this satellite era. We can compare this to the record we had previously in 2002. This was about 5.6 million square kilometers of the Arctic ocean covered by ice at that time. Compared to 2005, which is about 5.3 million square kilometers. That difference is about the size of the state of Colorado, which is a fairly large change.
But even more spectacular, if we look at 2005 as compared to the long-term average what we would expect from an average conditions we find that the amount of ice that we lost in 2005 is roughly equal to the size of Alaska; or twice the size of Texas.
THEN 2005 HAD THE LARGEST MELT OF ARCTIC ICE ON RECORD?
Yes, from what we can tell. One of the things we also know is that the length of the melting in the Arctic has increased and it appears that the duration of the melt in 2005 has also been extremely remarkable. That explains the losses of ice we’ve been seeing. There are many things that can influence the sea ice we know the winds blow the sea ice from place to place. The ice is not a static slab that just sits there. The winds blow it around. The oceans have an influence. But if we look at the big picture is what we find is that the Arctic is simply warming up and that helps us to understand why we are seeing these big reductions in sea ice.
More Dark Water Increases Heating and Ice Melt
WHAT IS IT ABOUT THE MELTING OF THE ICE, WHICH IS WHITE, THAT EXACERBATES THE WARMING?
Sea ice is A very reflective white which means it reflects most of the sun’s energy right back to space. What has been happening is a reduction in the area of Arctic Ocean covered by sea ice, so that exposes areas of open ocean dark colored open ocean instead of white ice. Now in those dark ocean areas, those can absorb a great deal of the sun’s energy. We start to have a situation where we absorb more sun energy in the ocean. The oceans start to heat up. If the oceans heat up, that means it’s harder to grow ice the following fall and winter. So the ice we get the next spring and summer tends to be thinner and not as much of it. That means more can disappear that next summer, leaving more open, dark water, meaning more absorption of heat, more ice melts and so on. A vicious cycle, if you will, but something we call a positive feedback.
This is one of the processes we think is starting to kick in the Arctic that helps us explain some of these big reductions in the Arctic sea ice.
IF THIS HAS BEEN HAPPENING FOUR YEARS IN A ROW AND THE LIKELIHOOD IS NEXT YEAR AND THE YEARS AFTER THAT THE ARCTIC ICE WILL MELT EACH SUMMER, DOES THAT MEAN THE COMPUTER MODEL PROJECTION THAT THE ARCTIC WILL BE ENTIRELY ICE FREE DURING THE SUMMER WILL BE MUCH EARLIER THAN 2070?
It’s possibly could happen earlier. Yeah. It’s hard to say. One of the things we know are that the computer models are the very best representations of how the climate system works. But they certainly are imperfect. And one of the real problems is that in the Arctic there are complex processes that are difficult to incorporate properly into the numerical models. The feedback involving the sea ice and the oceans warming this is one of the very things that these sorts of models have in dealing with them. So, there are uncertainties here. Could it happen earlier? Could the ice be gone earlier than some of the models project? Certainly. Might it be later than some of these models project? That could be as well. But I think the general picture is that there is a pretty decent agreement now between what the models are saying and what the observations are saying.
Consequences of Summer Arctic Ice Melt
WHAT IS THE DOWNSIDE OF LOSING THE ARCTIC ICE IN THE SUMMER?
It depends on how you want to look at it. In terms of local effects, certainly there are going to be a lot of influences. One would be coastal erosion. Already you are seeing villages in coastal Siberia and Alaska that are having to be evacuated or moved because of coastal erosion. What’s happening here is that as you lose that sea ice cover, you expose the open ocean and much larger waves can form. The winds can blow over the open water, cause large waves and coastal erosion results. The effect is exacerbated, at least locally, by the fact that in some areas, permafrost is starting to melt. Permafrost is perennially frozen ground. You can think of it as the glue that holds the soil together. The permafrost is starting to warm and melt and that goes hand in hand with coastal erosion. That’s one thing, a local problem.
Also, certainly in terms of people who live there and the animals who live there. Some people are saying now that in the next century polar bears might become extinct, for example, because the polar bears require that sea ice to live on. Their livelihoods are based on that ice world.
Those are things that happen in the Arctic itself. A bigger question is: how might changes in the Arctic translate to changes in the mid-latitudes, to places in the United States, England and Russia? How might the Arctic changes effect the climate there? These are one of the things we have to be careful about in terms of surprises.
Could there be a surprise that we’re not ready for? Some large scale reorganization of the atmospheric circulation, for example, that all of a sudden that places the southwestern United States in a long-term drought. In fact, there have been long-term climate model simulations that show just that. That’s one example of the sorts of things that might happen.
Will that happen will we see drought in the southwestern U. S. associated with a changing Arctic? Maybe. Maybe not. But it’s one example of the sorts of things we have to be aware of and be ready for.
Melting More Rapid Than Expected?
SOME SCIENTISTS I HAVE INTERVIEWED THIS YEAR HAVE STRESSED THAT IT IS THE RAPIDITY WITH WHICH THE WARMING IS TAKING PLACE THAT SURPRISES THEM. IF THE RAPIDITY INCREASES FROM GLACIER MELTS IN PERU AND HIMALAYAS TO THE ARCTIC ICE, THAT IT MEANS THE CLOCK IN THE COMPUTER MODELS HAS TO BE SPEEDED UP?
That could be true. That could be true. If we look at the changes in the Arctic we’ve been talking about, we’ve just been flabbergasted at the rapidity of the changes. Yeah, maybe we have to set those clocks forward. But the thing you always have to remember is that the Arctic always has been highly variable and always will be highly variable.
WHAT DO YOU PERSONALLY WORRY ABOUT THE MOST FOR THE U. S. FUTURE?
What do I personally worry about most for the U. S. future? I would say ignorance and complacency. We seem to think of the effects of greenhouse warming as something that we don’t have to worry about that maybe our grandchildren will have to worry about it, or maybe their grandchildren. But if you ask me, I think it is something that is starting now. It’s not something that is going to happen far into the future. It’s a problem that’s starting to be felt now and I think it’s the complacency that bothers me. We just let the problem fester until it’s too late to deal with it.
Could Large Arctic Summer Ice Melt Contribute to Hurricane Intensity in Atlantic?
IN THE COMPUTER MODELS, IS THERE A LINK BETWEEN THE INTENSITY OF THE HURRICANES THAT WE ARE SEEING IN WHAT MIGHT BE A NATURAL EARTH CYCLE? THE INTENSITY OF KATRINA EVEN SURPRISED THE NATIONAL WEATHER SERVICE
Right.
COULD HURRICANE INTENSITY BE LINKED TO THE FACT THAT THE ICE MELT IN THE ARCTIC IN THE SUMMER WAS CHANGING SOME KIND OF GLOBAL INTENSITY OF MOISTURE AND WIND?
the arguments for and against a link between global warming and the increasing intensity and numbers of hurricanes is very controversial at this point very controversial and it’s getting very polarized. From a global warming perspective, from a greenhouse perspective, certainly there are some good arguments there. We think about these hurricanes. What do hurricanes feed on? They feed on warm oceans. The idea is, of course, that if we warm up the planet with greenhouse gases, the oceans warm. That means the oceans have better fuel they can better fuel (hurricanes) with heat and so we could expect stronger, more intense hurricanes.
But we also know that the frequency and intensity of hurricanes does show strong, natural variability. There are strong natural cycles to that and we appear to be in the part of the cycle where it’s particularly warm say, out in the Gulf of Mexico. This gives us much stronger hurricanes.
So, the question is: we understand there is a natural cycle to this, but might we be hitting it with greenhouse gases in such a way that now there is an additional whammy here.
RIGHT.
That’s one of the million dollar questions. You’ll find a lot of very solid scientists saying: ‘No, there is no link between the greenhouse warming and the intensity of hurricanes.’
There are also a number of very good scientists arguing that there IS a link very controversial, a lot of very good people working on it, and hopefully we’ll have some answer to that fairly soon.
COMMON SENSE WOULD SAY THAT IF THE OCEANS ARE WARMING, ARCTIC ICE IS MELTING RAPIDLY, THAT THERE HAS TO BE SOME LINK BETWEEN THE WARMING OF THE OCEANS , HURRICANE INTENSITY, AND THE MELTING OF THE ARCTIC ICE.
That’s right, but a link in terms of both being forced by the same thing both being forced in some way by a greenhouse warming. But you can’t really make the argument that the changes we are seeing in the Arctic have some direct cause and effect link with the hurricanes.
There is no evidence for that that I’m ware of. The evidence is much better that both are responding to the same basic forcing, that is a greenhouse warming.
Solar Cycles Contributing to Global Warming?
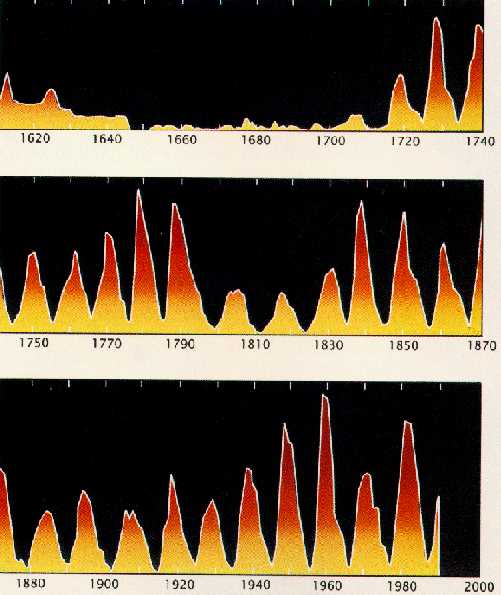
I’M ALSO CURIOUS WHAT YOUR PERSPECTIVE IS ABOUT THE CONTRIBUTION AND INFLUENCE OF CYCLES IN THE SUN TO WHAT IS HAPPENING IN GLOBAL WARMING?
There is certainly something to it, something to the solar variability. On the one hand, you’ve got a number of scientists who want to brush that under the rug. On the other hand, you have a number of scientists who are saying, ‘No, there are very strong solar influences on our planet.’
I think the best evidence is that there is a link between solar variability and climate. The question is: how strong? It appears that part of the warming we’ve seen in the 20th Century over the globe part of that is due to solar influence. But it seems to be increasingly swamped by the (industrial) greenhouse effect, or at least that’s the argument. But solar variability is not the sort of thing you want to brush under the rug. We need to think about the climate system as a whole. What’s the ultimate driver of the climate system? The sun! The sun is the ultimate driver. So it makes sense that if you’re going to be thinking about climate change, climate variability, the sun is one of the places you want to be looking at as the ultimate driver of the system.
So, there are solar influences on climate. Just how they work, is not quite clear.”
100,000 Year Cycle of Ice Ages on Earth – An Astronomical Link?
The last time the Arctic was as warm, or warmer, that it is now was 130,000 years ago. That was a period between Ice Ages called the Eemian Interglacial. That warmth lasted for about 20,000 years. Then there was a sudden cooling at 110,000 years ago. That cooling went on for about 40,000 years, twice as long as the Eemian warm period. Most of northern Europe and Canada became covered by thick ice sheets because snow and ice never melted.
Then about 60,000 years ago there was another sudden warming that lasted about 30,000 years. That brings us to about 30,000 years ago when the Earth went into another deep freeze in which ice sheets spread across the northern latitudes and is called the Last Glacial Maximum.
Finally about 12,000 years ago, the planet entered another warming phase, which has been going on since and has been intensified the past 100 years by the Industrial Age which has put so much carbon dioxide into the Earth’s atmosphere.
What’s fascinating in this global climate research are the somewhat regular cycles of heating and warming before the Industrial Age. that shows over the past 750,000 years of Earth’s history, Ice Ages have occurred at approximately each 100,000 years. And scientists are learning that the 100,000 year cycle might be caused by variations in the shape of the Earth’s elliptical orbit an astronomical cause.
The unstable nature of the Earth’s climate history suggests that it might change suddenly in the future and what some scientists fear is that human greenhouse gases could cause an unstable change we might regret. As Columbia University geophysicist, Wally Broecker, told me: “Climate is an angry beast, and we are poking it with sticks.”
Websites:
NSIDC: http://nsidc.org/news/press/20050928_trendscontinue.html
Polar Bears: http://www.polarbearsinternational.org/
© 1998 - 2024 by Linda Moulton Howe.
All Rights Reserved.