
© 1999 by Linda Moulton Howe
August 29, 1999
Oddball Quasar
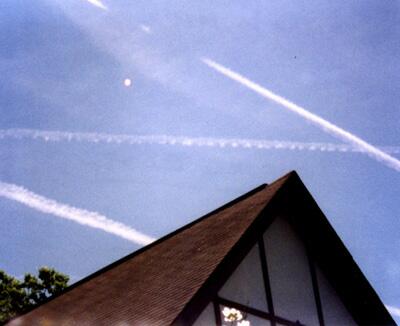
Cambridge, England Last week Cambridge scientists said they were puzzled by mysterious, dark bands in the sky just before and after the August 11th eclipse. But Dan Green, Director of Harvard's Smithsonian Astrophysical Observatory, told me that the horizontal bands have been seen before in other total solar eclipses and are thought to be atmospheric distortions.
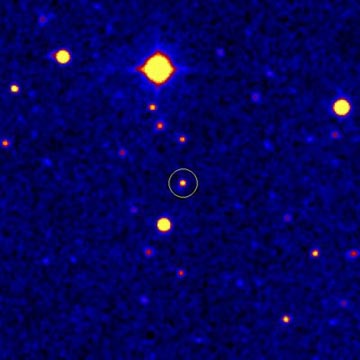
This week I also talked with Astronomer George Djorgovski (jor-GOV-ski) at the California Institute of Technology in Pasadena, about a mysterious star his team photographed during their Large Digital Sky Survey. The astronomers noticed an oddly colored star in the constellation Serpens, the Snake.