
“Very reasonable computer models suggest a point of irreversibility for Greenland exists at a warming between 2 and 3 degrees Celsius and we’re already looking at a warming of about 2 degrees C., maybe 3 degrees C. over this century. So, it seems that if this irreversibility point exists, that we’re getting frightfully close to it.”
– Jason Box, Ph.D.
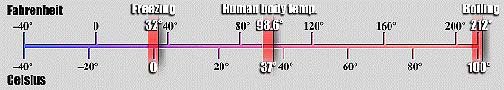
March 17, 2006 Albuquerque, New Mexico – Over the past 100 years, our planet’s global average temperature has increased one degree Fahrenheit. In 2005, that average surface temperature was 58.3 degrees Fahrenheit – the hottest year on record ever in modern human history. In fact, the last time the Earth was this warm is estimated to be at least ten thousand years ago, or longer. Some scientists think the last time was the Pliocene 3 million years ago.
By the end of this century, the average global surface temperature is expected to increase perhaps another 3 degrees Fahrenheit – and maybe as much as 10 degrees F. – depending on CO2 and methane increases in the atmosphere. That means over the next several decades, the Earth‘s global average temperature could rise three more times than last century.
Some people argue the cause is natural variability of our planet wobbling around the sun and not the human Industrial Revolution.
However, I have talked with a scientist renowned for his ice core investigations of historic climate changes. He says the hard evidence is that this planet’s wobble distance and polar tilt have been farther from the sun for a long time, not closer. He also says that in Antarctic ice cores which go back nearly a million years – none of the ice layers show CO2 levels as high as they are now in 2006, which is 381 parts per million volume – and climbing. In fact, 2005 saw the largest increase in CO2 on record.
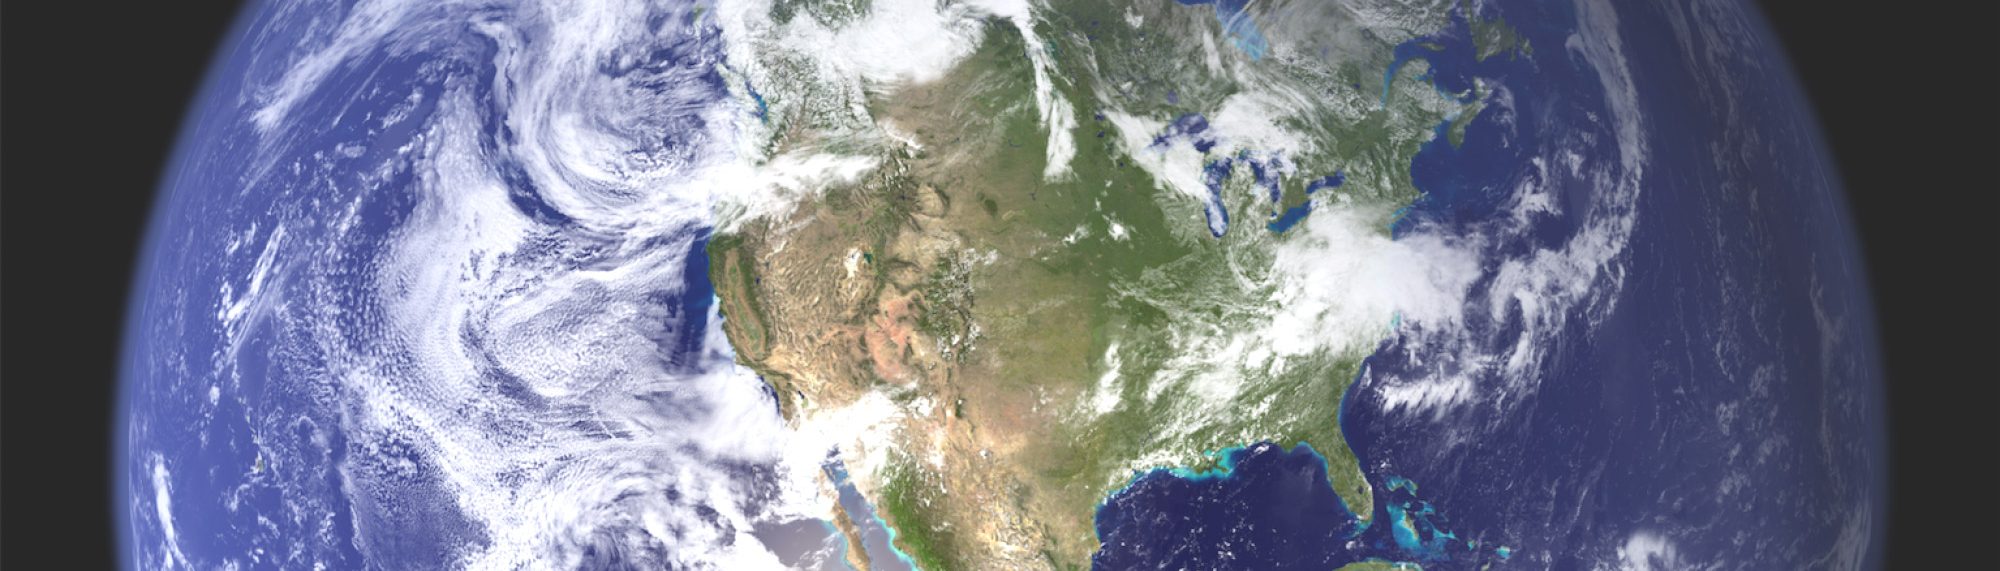
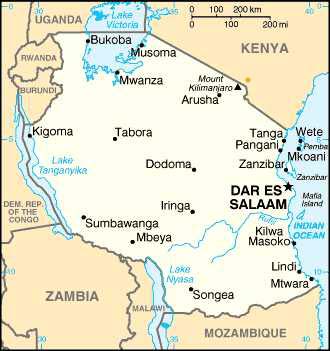
I’ll begin with the ice melt down all over this planet that is happening faster than anyone expected. The melt down includes Greenland, Antarctica, mountain glaciers and the Arctic. Tonight I’m focusing on the latest science reports from Antarctica, Greenland and Mt. Kilimanjaro – ice that’s on land melting into the oceans.
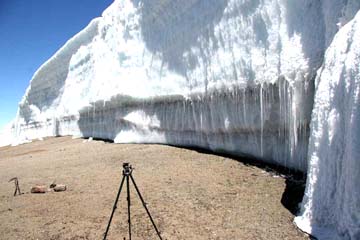
I’ll start with the massive ice sheet of Greenland, which covers more than 650,000 square miles. In some places, the ice is two miles thick. If it all melted into the ocean, sea levels around the world would rise 23 feet.
In February, NASA and university scientists reported that Greenland’s southern glaciers are melting twice as fast as they did only ten years ago. In fact, the southern Greenland glaciers are among the world’s fastest – moving at eight miles a year, dumping into the Atlantic Ocean so much water that it is now equivalent to 225 times what Los Angeles uses in a year. That ice melt is accelerating so much that it could double again by 2015.
Global warming computer models have not had this kind of rapid melt down data before in their scenario for Greenland. So, now the sea level rise projection is going up.
Prof. Jason Box, Ph.D., at the Byrd Polar Research Center at Ohio State University in Columbus, has been repeatedly visiting Greenland over the past decade. Recently he returned from another trip and told me he was surprised by the current melt in the southern glaciers.
Interviews:
Greenland
Jason Box, Ph.D., Professor of Geography and Fellow, Byrd Polar Research Center, Ohio State University, Columbus, Ohio: “In going to Greenland, I was never expecting the changes to occur as rapidly as they have. I have been going there for more than twelve years each year.
But what has made these glaciers accelerate beyond any recent observations is the warming that has gone on around Greenland that is well-documented in temperature records at coastal stations. The melting is occurring for a longer period of time, so the glaciers are flowing faster, longer.
WE KNOW THAT 2005 BROKE ALL RECORDS OF ALL TIME AS BEING THE WARMEST YEAR FOR AVERAGE GLOBAL TEMPERATURE. THE PROJECTION FOR THE REST OF THIS CENTURY IS FOR INCREASING WARMTH. RIGHT NOW, WHERE DOES THE COMPUTER SHOW THAT THE MELT ON GREENLAND IS GOING TO APPRECIABLY START CAUSING SEA LEVEL RISE?
Greenland is already contributing significantly to sea level rise. Our best estimate right now is that Greenland contributes about 1/3rd of the global sea level rise. So at the end of this century at 2100, we expect sea levels to be two to three feet higher than today. How much the sea level rises depends on the warming patterns.
Another way to think of this is that more than 100 million people globally live within 3 feet of vertical sea level. So, millions of people can be affected by sea level rise.
A large population that is threatened by sea level rise is in Bangladesh. They don’t really have higher ground in that nation and more than 100 million people live there.
WHERE ARE THEY GOING TO GO? WILL GOVERNMENTS BE ABLE TO HANDLE THIS CRISIS?
Unfortunately, we are already committed to a significant sea level rise. The amount of carbon dioxide has gone up by almost 40% above pre-Industrial levels. That increase in the greenhouse affect will cause warming that has not yet fully kicked in. Right now, the oceans are absorbing about fifteen times the heat that land is. The ocean total heat content has really gone up dramatically.
Very reasonable computer models suggest a point of irreversibility for Greenland exists at a warming between 2 and 3 degrees Celsius and we’re already looking at a warming of about 2 degrees C., maybe 3 degrees C. over this century. So, it seems that if this irreversibility point exists, that we’re getting frightfully close to it.
ONCE WE ARE THERE, WHAT YOU ARE SAYING IS: GREENLAND CONTINUES TO MELT DOWN?
Yes, at the point of irreversibility, even over the course of a cold year, it’s possible the ice sheet would still be losing mass.”
Antarctica
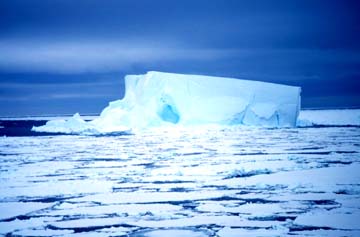
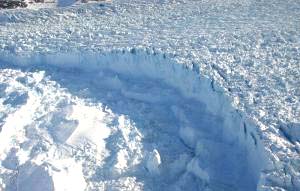
Joining Greenland in melt down is Antarctica, especially the West Antarctic ice sheet. It’s not only melting more rapidly than expected, its ice shelves are very unstable as the ocean water around them is heating up. If all the West Antarctic ice sheet broke up and slid into the ocean, worldwide sea levels would rise twenty feet.
So, in some distant future, if all the Greenland and West Antarctic ice melts into the oceans, global sea levels would rise forty-three feet.
Using two NASA satellites, scientists from the University of Colorado have made the first study of total mass balance of the entire Antarctic ice and found it to be “in significant decline.” It’s melting at the rate of 36 cubic miles a year.
One of the project leaders on the Antarctic satellite study is John Wahr, Ph.D., Professor of Physics at the University of Colorado and Fellow at the Cooperative Institute for Research in Environmental Sciences in Boulder.
Antarctic glaciers began moving more rapidly into the ocean in recent years after some ice shelves melted and broke up.
John Wahr, Ph.D., Prof. of Physics and Fellow, Cooperative Institute for Research in Environmental Sciences (CIRES) , University of Colorado, Boulder, Colorado: “And as soon as they break up, then the glaciers (behind them) are free to move more rapidly into the ocean.
Evidently, that is tied to global warming in the sense that they are floating ice shelves. As they get the water around the ice shelves warmer, they come in underneath the ice shelves. There is now warmer water underneath the ice. It tends to accelerate the melting and pretty soon the ice shelf is gone. What our results show is that increase is evidently dominating over the increase in snowfall.
We found that the total loss of mass in the Antarctic ice sheet between 2002 and 2005 has been enough to raise sea level by .4 millimeters per year.
But another way to think of it is: If you covered all the state of California with water, that’s enough water every year to reach a depth of 14 inches, a little more than a foot over the entire state.
THAT MUCH IS GOING INTO THE OCEAN?
Every year, at least for the last 3 years that much went into the ocean.
WHICH IS A LOT! I THINK SOMEONE COMPARED IT TO A LAKE TAHOE GOING INTO THE OCEAN EVERY YEAR.
That’s exactly what it is. The issue is: will that continue and maybe accelerate?
This (new data) seems to show that Antarctica is not in balance probably because of this accelerated glacier flow into the oceans. So, it’s something we’re all going to have to monitor carefully for the next few years to see if it does accelerate.
Where this is probably coming from – in fact, we know it’s coming from – West Antarctica
beneath South America. That’s a very unstable place because the ice there is resting on bedrock that is beneath sea level.
IF THAT ENTIRE WEST ANTARCTIC ICE MASS WENT INTO THE OCEAN, BREAKING UP, HOW HIGH WOULD SEA LEVEL RISE?
It would rise by about 20 feet.
GLOBALLY.
Globally, that’s right. But, of course, this is not going to happen over a few years. At the present rate (of melt), it would take thousands of years.
What we have to worry about is: Is this an indication that things are really starting to happen and shake loose down there (in West Antarctica)?”
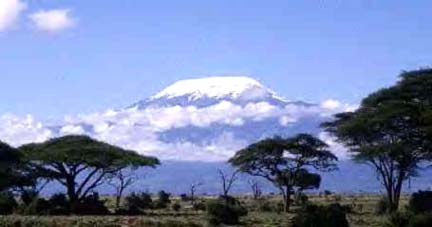
Mt. Kilimanjaro, Tanzania, Africa “Shining Mountain”
“What will happen to the water supply for these people when the glaciers disappear? And disappear they surely will.”
– Lonnie Thompson, Ph.D.
While there is still a lot of ice left to melt in Antarctica and Greenland, the glaciers on top of Earth mountains – ranging from the Himalayas to South America and Africa – are melting so fast that many are expected to disappear in the next ten to fifteen years.
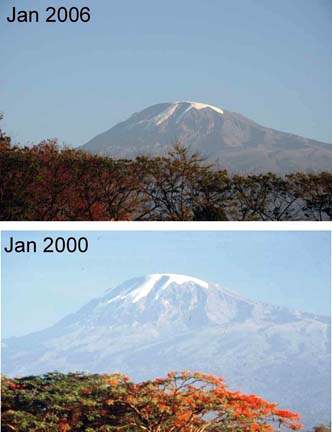
In fact, the famous, and once glistening white glaciers atop Mt. Kilimanjaro in Tanzania, Africa, will be completely gone in less than a decade.
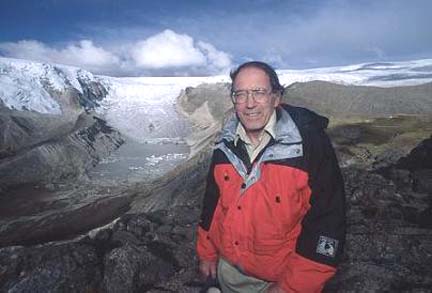
Dr. Lonnie Thompson, Distinguished Professor of Geology, and Research Scientist at Ohio State University’s Byrd Polar Research Center, has been traveling to mountain glaciers for twenty years to monitor their decline. He is discouraged by the rapid melt of ice that for centuries has provided fresh water for humans and animals all over this planet. When the mountain glaciers are gone, what will replace that water? What happens to crops? Climate refugees – both human and animal – will be forced to migrate as this globally warming century unfolds. But to where? At what cost?
Lonnie Thompson, Ph.D., Distinguished Prof. of Geology, Dept. of Geological Sciences and Research Scientist, Byrd Polar Research Center, Ohio State Univ. (OSU), Columbus, Ohio: “I believe that if you look at glaciers in the big scheme of things, they are one of our temperature regulators for the planet. Mountain glaciers and big ice sheets, a lot of heat is being taken up in the melting of those ice fields. But as those ice fields get smaller, they become less and less effective in taking up that heat. So, we’re losing one of our balancing mechanisms we have in our climate system.
SO, THE MORE WE MELT, THE FASTER WE MELT?
Yes. We just returned from Mt. Kilimanjaro on Feb. 6, 2006, so that we could determine how much ice had been lost over the five years since we did this last time. We were amazed at the changes in the ice during the time we were on top of the mountain. But also, just in comparing the aerial photos from 2000 to 2006. It’s clear that the glaciers are on track for disappearing and we believe that when we actually do the numbers, we’ll be able to show that the rate of loss has actually accelerated.
AND IF IT HAS ACCELERATED, WHAT IS THE EARLIEST DATE THAT THERE WILL NO LONGER BE ANY SNOW ON MT. KILLIMANJARO?
As far as the timing of when the glaciers will disappear, that’s an interesting question. In 2003, for the first time that we have any record of, it was observed along the side of the Furtwangler Glacier a lake actually bursting out of the side of that ice field.
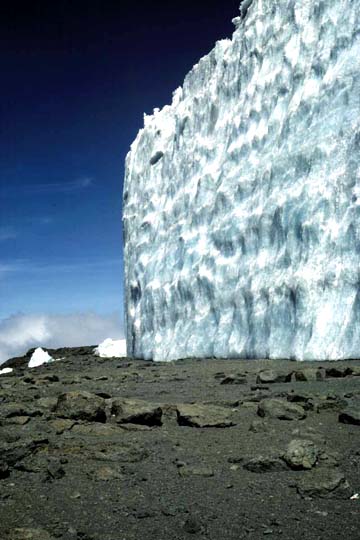
Since 2000 (to 2005), melting has started to occur. Ice is a threshold system. It’s pretty stable up to temperatures below freezing, but as the temperatures rise above freezing and you get the formation of water, then you change the albedo. There is less energy being reflected from the surface and more radiation being absorbed. That puts it in a positive feedback. So, it’s quite possible that the glaciers will disappear much quicker.
[ Editor’s Note: Albedo is the measure of reflectivity of a surface or body. It is the ratio of electromagnetic radiation (EM radiation) reflected to the amount incident upon it. This ratio depends on the frequency of the radiation considered: unqualified, it refers to an average across the spectrum of visible light. It also depends on the angle of incidence of the radiation. Fresh snow albedos are high: up to 9%. The ocean surface has a low albedo. The average albedo of Earth is about 30%, while the albedo of the moon is about 7%. In astronomy, the albedo of satellites and asteroids can be used to infer surface composition, most notably ice content Enceladus, a moon of Saturn, has the highest known albedo of any body in the solar system, with 99% of EM radiation reflected.
Human activities have changed the albedo (via forest clearance and farming, for example) of various areas around the globe. However, quantification of this effect is difficult on the global scale: it is not clear whether the changes have tended to increase or decrease global warming.
The “classical” example of albedo effect is the snow-temperature feedback. If a snow covered area warms and the snow melts, the albedo decreases, more sunlight is absorbed, and the temperature tends to increase. The converse is true: if snow forms, a cooling cycle happens. Source: Wikipedia ]
I THINK 2015 IS ONE OF THE PROJECTED YEARS AND THAT’S ONLY NINE YEARS AWAY.
Nine years away, yes. As these ice bodies shrink, then there is more and more of the crater floor being exposed and more solar radiation being absorbed, which drives up the temperature and leads to more ice melt and quicker acceleration of rate of loss. It’s very clear that these ice fields are going to disappear. Then you need to know what is the impact for these people.
BECAUSE IF THERE IS NO SUBSTANTIAL ALTERNATIVE WATER SOURCE TO THE GLACIERS ON TOP OF MT. KILIMANJARO, THOSE PEOPLE ARE FACED WITH HAVING TO MOVE TO SURVIVE?
Exactly. This is a real problem. If you look at the current population in Tanzania where Mt. Kilimanjaro is located, it’s about 37 million people. But by 2050, that is projected to be 67 million! They are suffering from water shortages in today’s climate, so it will be growing more critical as we go forward in time. And I would say that in places like Tanzania, where you have the Indian Ocean to the east, desalinization of ocean water might be a factor in supplying fresh water as we go into the future.
Most of the models which look at the impacts of global warming show that as the Earth gets warmer, there are places where it will get wetter and there will be heavier precipitation. But in the central areas of continents where a lot of grains are grown globally, those areas tend to become warm and dry. So, we would expect to see this trend continue as temperatures around the planet continue to rise.
WHAT I’M HEARING IS THAT TODAY IN 2006, THE PLANET IS CONSUMED BY THE ISSUE OF TERRORISM. BUT IN ANOTHER TEN, FIFTEEN OR TWENTY YEARS, THE LACK OF WATER AND FOOD WOULD MAKE TERRORISM SEEM LIKE A GNAT ON THE SURFACE OF THE EARTH.
I agree totally with that. In 2003 in Europe, they had a heat wave that killed over 49,000 people. We’ve come off of two years of significantly more intense hurricanes. The cost, the loss from those hurricanes – both in terms of lives and property – have been tremendous – with Katrina being more loss in one year than had ever occurred before.
One of the questions is: What does it take to wake us up?”
One energy alternative is production of methanol from grain crops. Brazil is doing that. But for every possible solution, other problems multiply. Any country that decides to turn over a lot of crop land to generating fuel for cars and industry is competing with its own food production.
Prof. Thompson also is concerned about China’s 1.3 billion people and their need for more food and energy. Changing climate is bringing great drought to parts of that nation and North Korea. There are places in China where the water table has been dropping a meter a year since the 1980s. Currently, both China and North Korea have what is called a “5th Season” beyond winter, spring, summer and fall. It’s the “Dust Season,” which is in the spring. It’s so bad now that people have to wear masks and schools are canceled and people cannot go shopping. What happens if the dust bowls keep expanding, threatening water and food supplies?
Earth Wobbles and Ice Cores
As the Earth is warming up with hard data to prove that warming, there are people who will argue that the “real cause” of global warming is the sun, or a natural variation in the Earth’s orbit around the sun.
About the sun’s role, this week I talked with David Hathaway, Ph.D., Solar Physics Group Leader at the NASA Marshall Space Flight Center in Huntsville, Alabama. Even though the last couple of years, the sun had some extraordinarily strong X-flares while it’s supposed to be at solar minimum, the past few months the sun has behaved normally. Sunspot numbers are low as they should be and no substantial increase in solar energy has been measured in modern times that might explain the current and significant warming of the Earth.
Now, what about the Earth’s tilt and wobbling motion as it moves around the sun in an orbit that is not perfectly circular? I got a reality check about this question from Dr. Richard Alley, Prof. of Geosciences at Pennsylvania State University in University Park, Pennsylvania. For years he has been studying the Earth’s climate through ice cores. He has also studied the three orbital cycle variations of our Earth over thousands of years which can bring the Northern Hemisphere either closer or further away from the sun.
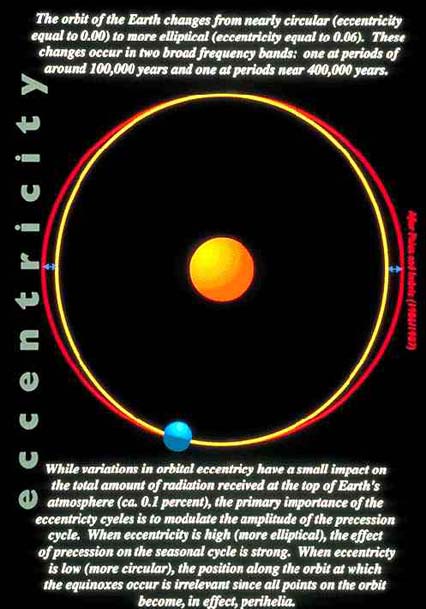
Richard Alley, Ph. D., Prof. of Geosciences, Pennsylvania State University, University Park, Pa: “One (variation) is how round the Earth’s orbit is about the sun. It’s elliptical, but it’s more squashed and then less squashed. It’s almost round and then highly squashed. It takes about 100,000 years to go from squashed to round to squashed.
Second, there is the tip of the North Pole. Does it sort of lean over so that the North Pole can get a sunburn? Or does it stand straight up so the North Pole can’t get a sunburn? That varies over about 41,000 years.
Third, there is a wobble. Because the orbit is squashed rather than round, do we have Northern Hemisphere summer – which is when the bald spot on top is pointed at the sun – Do we have Northern Hemisphere summer when we’re close to the sun? Or when we’re far from the sun?
Summer and winter are not close and far. They are the temperature. They are not the distance. So, you go from having Northern Hemisphere summer close to having it far and back over about 19,000 to 23,000 years. It’s not a perfect periodicity. There’s a wobble in it.
So, the three of these are all going on together. These are the factors that have paced the ice ages. So, the reason why we go from a world with little ice to a lot of ice and back has been these variations. When the northern lands get very little summer sun, then you can grow ice. And when the northern lands get a lot of summer sun, then you melt ice.
At the present time, we’re sort of at a turning point where we go from having lost the northern sun to gaining the northern sun. So right now, not a lot of change is going on at all. The long-term would be a slow increase in northern sun over many thousands of years. The change associated with these wiggles over years or decades or even centuries is very small. The change over 10,000 to 100, 000 years is fairly large. But over the time scales we humans think of, it’s not terribly big.
THAT’S WHY THEN, IT IS VERY CLEAR THAT IF WE HAVE ACCELERATED ICE MELT IN GREENLAND AND ANTARCTICA IN JUST THE LAST 5 TO 10 YEARS, THE CAUSE HAS TO BE WHAT WE’RE DOING ON THE EARTH?
It’s fairly clear that the changes in Greenland and Antarctica are linked to warming in the regions that are changing – either warming of water under ice shelves is melting them and letting things go faster. Or more warming on the surface.
The temperatures in the polar regions reflect the global signal. Yes, if you change CO2, it effects the poles as well as the equator. If you say that Nature rolls the dice to see what the weather will be, we are making the die be loaded. And we’re loading it toward warming. And the warming comes up. But it might have come up warmer by itself.
BUT ONE WAY OR THE OTHER, WE ARE THE ONES CONTRIBUTING TO THE CO2 BLANKET AROUND THE EARTH?
We are the ones contributing to loading the dice to make it warmer, yes.
Ice Core Research
WHEN WAS THE LAST TIME THAT GREENLAND DID NOT HAVE AN ICE CAP?
I wish we had an answer to that. The usual answer is there has been ice on Greenland for 3 million years. It is just possible that it was smaller. There is fairly good evidence it was somewhat shrunken about 120,000 to 130,000 years ago. It’s conceivable that it was shrunken even more than that. But the usual answer is about 3 million years.
WHAT ABOUT ANTARCTICA?
The longest record so far in Antarctica – they probably pushed it past 800,000 years. It’s very recently recovered. There are still analyses going on. So, the greenhouse gas record has only been published out to about two-thirds of a million years. But it’s headed toward 1 million years, but not there yet.
IN THE MILLION YEARS, IT HAS ALWAYS HAD ICE?
Yes.
IN THE TWO-THIRDS OF A MILLION YEARS THAT YOU’VE BEEN ABLE TO LOOK AT CO2 LEVELS IN THE ANTARCTIC ICE, HAS ANYTHING EVER REACHED THE LEVELS WE HAVE NOW IN OUR ATMOSPHERE?
No. The levels now are a bit above what Nature was doing over that interval.
SO FOR A MILLION YEARS, WE HAVEN’T HAD THIS MUCH CO2 AROUND THE EARTH?
Over that time, humans have pushed CO2 out of the band of natural variability, yes.
IT’S SUPPOSED TO DOUBLE THIS CENTURY.
Yes.
WE ARE REALLY IN UNCHARTED TERRITORY THEN?
Certainly for the times that we humans have been here and modern and knowing what’s going on, we are changing things past what we’ve experienced, yes.
GIVEN THE FACT THAT YOU HAVEN’T BEEN ABLE TO DO ICE CORES PAST TWO-THIRDS OF A MILLION YEARS, IS THERE ANY ESTIMATE ABOUT WHEN WAS THE LAST TIME THAT ANTARCTICA DID NOT HAVE ANY ICE ON THE LAND?
If you go back before the Oligocene, back to the Eocene, into the Cretaceous, the time of the dinosaurs in the Cretaceous, there probably was either no ice or very little ice on Antarctica.
SO YOU HAVE TO GO BACK AT LEAST 65 MILLION YEARS?
Actually probably only about 35 million to 30 million, something like that.
IF AT THE TIME OF THE DINOSAURS, THERE WAS NO ICE ON ANTARCTICA AND IT’S NOW TWO TO THREE MILES THICK IN SOME SECTIONS?
Yes.
WHAT WOULD HAVE CAUSED THAT MUCH ICE BUILD UP SUDDENLY ON LAND THAT HAD NO ICE 65 MILLION YEARS AGO?
Yes, the best explanation actually is natural changes in carbon dioxide. Continental drift, opening up passageways between continents might have contributed as well. But the best explanation that Nature has changed carbon dioxide slowly over long times and for a bunch of very good reasons and that the dinosaurs lived on a world with a lot of carbon dioxide. As a consequence, it was very warm.
AND WE’RE HEADED IN THAT DIRECTION AGAIN NOW.
Headed in that direction again, yes.
WHEN WAS THE LAST TIME IN YOUR ICE CORE WORK THAT YOU HAVE FOUND THIS MUCH CO2?
No one has yet gotten an ice core long enough to find CO2 levels this high. So, the ice core record now goes back almost two-thirds of a million years and the record does not record anything as high as what we have now.
SO WHEN WE GO TO THE LAST INTER-GLACIAL PERIOD, WHICH WAS HOW LONG AGO?
About 125,000 to 130,000 years ago was the previous interglacial.
WHAT WAS THE CO2 LEVEL THEN?
I think it was around 280 – maybe up toward 300, but not as high as today (which is 381 ppmv).
FROM YOUR PERSPECTIVE AS A SCIENTIST STUDYING ICE CORES AND YOU LOOK AT THESE NUMBERS AND WHERE WE ARE NOW, WHAT IS YOUR REACTION?
I think humans are changing the atmosphere in a way that is changing the climate.
IS IT DANGEROUS?
(laughs) The question of danger really depends on what you are worried about and who you are worried about. There have been a variety of attempts to assess how dangerous is dangerous? If you live very close to sea level in a place where you don’t have a lot of bulldozers and a lot of money to build seawalls, there isn’t much you can do. As it gets warmer and sea level rises, this is clearly not a good thing for you. So there are some people for which even small changes can be dangerous to.
There are other people for which you would have to talk about a much larger change before you would call it dangerous. There is some evidence that would point to a little bit of warming as being helpful to our economy. When a big blizzard closes down the East Coast airports, it’s expensive.
But it depends on how you are counting and who you are. It might actually help the northern economies a little bit to have some warming. But too much warming would become a bad thing.
IN FACT, THE ESTIMATE IS THAT 100 MILLION PEOPLE TODAY LIVE WITHIN 3 FEET VERTICAL RISE FROM SEA LEVEL. AND IF THE PROJECTED SEA LEVEL RISE OVER THE NEXT DECADES IS THREE FEET APPROXIMATELY, THEN IT MEANS WE ARE GOING TO BE FACED LITERALLY MIGRATIONS AWAY FROM THE COASTLINES.
That would seem to be a reasonable presumption. If that many people are living there and the sea level comes up, they are going to have to do something.”
More Information:
For more information about global warming and glacier melts, please see the following reports in Earthfiles Archives:
- 02/20/2006 — Mysterious Deaths of Whales in Mexico
- 11/18/2005 — Is the Sun Heating Up?
- 10/07/2005 — Warmer Sea Surfaces and Increased Winds Make Hurricanes Stronger
- 09/29/2005 — 2005 Arctic Summer Ice Melt – Largest On Record
- 09/23/2005 — Phenomenon of “Instant” Hurricanes in 2005
- 08/05/2005 — Scientists Puzzled by “Bizarre” Pacific Coast Die-offs in 2005
- 05/11/2005 — Greenland Sea Cold Water Re-Cycling Has Nearly Stopped. Britain Expected to Become Cooler.
- 05/07/2005 — Did Milky Way Gas and Dust Turn Earth Into Icy Snowball Four Times?
- 02/26/2005 — Collapse of Societies: From Easter Island to Iraq – to Western World?
- 02/03/2005 — Kyoto Protocol Goes Into Effect February 16, 2005. British Scientists Warn Global Temperatures Could Climb Higher Than Earlier Estimates.
- 01/22/2005 — From U. S. to Arctic – A Sea Change in the Weather
- 12/31/2004 — Abrupt Climate Change Occurred Worldwide 5,200 Years Ago
- 11/02/2004 — North Pole Summers Without Ice?
- 10/15/2004 — Ever-Increasing Carbon Dioxide Build-Up in Atmosphere Since 1958
- 09/17/2004 — Cat 4 and 5 Hurricanes Charley, Frances and Ivan in Four Weeks -Unprecedented in American Recorded Weather History
- 08/27/2004 — Global Warming Impact On Birds – More Extinctions Expected
- 08/14/2004 — Oceans Are Absorbing A Lot of Greenhouse CO2. As Chemistry Changes, What Happens to Sea Life?
- 08/01/2004 — Sixth Straight Year Hundreds of Birds Die at Roestler Lake, North Dakota.
- 02/27/2004 — Abrupt Climate Change: Scenario from A Pentagon-Commissioned Report
- 11/29/2003 — Glaciers Are Melting Around the World So Fast That Water Supplies Could Be Threatened
- 05/30/2003 — Scientists Surprised by Common House Fly Fossils in Antarctica
- 12/14/2002 — Arctic Rivers’ Fresh Water Flows Could Change Atlantic Ocean Current
- 11/14/2002 — What Happened 12,000 Years Ago That Killed So Many Animals?
- 10/21/2002 — Mt. Kilimanjaro’s Ice Cap Is Melting Fast
- 08/27/2002 — August 2002: Severe to Moderate Drought in 37 States
- 07/20/2002 — Extinctions of Earth Life Are Accelerating Rapidly
- 06/04/2002 — EPA Admits Humans Burning Fossil Fuels A Big Factor in Global Warming
- 03/30/2002 — Drought Worsens in United States
- 03/21/2002 — Antarctic Peninsula Is Melting – And So Is Arctic Ice
- 02/13/2002 — January 2002 Warmest On Record For Whole World
- 01/05/2002 — Global Warming Update – Could Increasing Carbon Dioxide Gas Be Transformed Into Limestone?
- 12/22/2001 — Scientists Warn That Climate and Earth Life Can Change Rapidly
- 04/18/2001 — April Environmental Updates
- 03/24/2001 — Alps Permafrost Melting
- 03/21/2001 — Earth Hasn’t Been This Warm Since the Pliocene 3 Million Years Ago
- 03/04/2001 — Disappearing Glaciers – Evidence of A Rapidly Warming Earth
- 02/25/2001 — Environmental Updates
- 02/18/2001 — Environmental Updates and Mysterious Deaths of 2000 Atlantic Brant Geese
- 02/07/2001 — 94% Decline In Aleutian Islands Sea Otter Population
- 01/28/2001 — U. N. Global Warming Forecast: Up to 10.5 Degrees F. Hotter At End of 21st Century
- 11/26/2000 — Environmental Updates
- 10/30/2000 — Science, Environment and Medical Updates
- 09/10/2000 — Arctic Ice Melt Threatens Polar Bears
- 09/10/2000 — Largest-Ever Antarctic Ozone Hole
- 06/17/2000 — Spring 2000 – Hottest On Record in U. S.
- 05/07/2000 — Serious Drought in the Great Lakes
- 04/20/2000 — Severe Arctic Ozone Loss and Deep Ocean Warming
- 01/13/2000 — Computer Projections About Earth Weather 2000-2100
- 01/09/2000 — Global Warming Alert from NOAA and U.K.
- 12/25/1999 — Y2K Nuclear Concern and Global Warming Update
- 09/26/1999 — Could Ancient Microbes in Polar Ice Cause Epidemics?
- 07/25/1999 — Maryland Fish Kills; Global Warming; and Warm Oceans and Disease
- 06/04/1999 — Global Warming Linked to Increasingly Warmer and Wetter Winters in Europe & Western North America
- 05/05/1999 — Two Antarctic Ice Shelves Almost Gone
Websites:
Byrd Polar Research Center: http://www-bprc.mps.ohio-state.edu/
Glaciers and Ice Sheets: http://www.solcomhouse.com/icecap.htm
Lonnie Thompson: http://researchnews.osu.edu/archive/scndkili.htm
National Climate Data Center (NCDC): http://www.ncdc.noaa.gov/paleo/
National Snow and Ice Data Center: http://nsidc.org/
© 1998 - 2026 by Linda Moulton Howe.
All Rights Reserved.