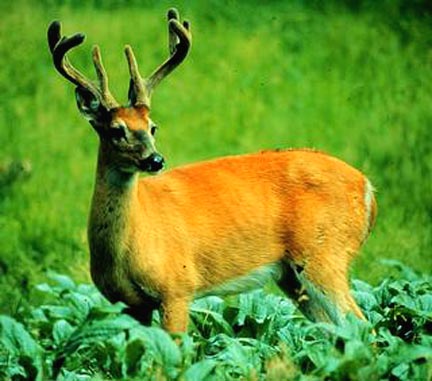
April 6, 2002 Madison, Wisconsin - On February 28th, the Wisconsin Department of Natural Resources (DNR) confirmed three cases of deadly chronic wasting disease (CWD) in free ranging white-tailed deer in the Mount Horeb area of western Dane County. This week that number jumped to ten. Since March 5, 2002, the DNR has collected 197 deer samples from that region and plans to collect 300 more. CWD is a prion disease that attacks brains and nervous systems similar to mad cow in cattle, scrapie in sheep and new variant Creutzfeldt-Jakob and kuru in humans. The culprit in both animals and humans is called a prion. Prion stands for proteinaceous infectious particles. More simply, prions start out as normal proteins that mysteriously change shape and then destroy brain and nerve tissue. To this date, no one knows what caused the proteins to change shape in the first place or how misshapen proteins are transmitted. There is no blood test to find prions while animals are alive and no cure after prions are confirmed. Death usually occurs within weeks or months.
Click here to subscribe and get instant access to read this report.
Click here to check your existing subscription status.
NASA showed this March 21, 2002 Goddard Space Flight Center SeaWiFS image captioned, "Mysterious black water blankets Florida Bay." The dark water between Naples and the Florida Keys was first reported by fishermen and pilots back in January. By the middleof March, the dark waters had spread to an estimated 100 miles and scientists began to take and analyze water samples. Satellite image courtesy NASA.
April 1, 2002 Marathon, Florida - Fishermen who have spent their lives catching marine life in the waters between Naples and the Florida Keys began calling news media in January to report massive areas of water so dark and dense it was eerie and many said they had never seen anything like it before. By the middle of March, NASA satellite images clearly showed dark waters that at one point spanned an estimated 100 miles. Fishermen also noted that dead plants from the ocean floor seemed to rise up and follow the movement of the dark water through Florida Bay and the Keys. Fish seemed to turn away from the dark currents and eventually scientists discovered that coral and sponges had died or were dying in certain channels where the dark waters had been.
Click here to subscribe and get instant access to read this report.
Click here to check your existing subscription status.
"If we don't have replenishing rains that really begin to fill the reservoirs and ... start refilling some of the groundwater tables, then we're going to continue to deplete our water resources and the economic and environmental impacts of that are going to just be devastating."
- Don Wilhite, Director, National Drought Mitigation Center, University of Nebraska, Lincoln, March 29, 2002
Graphic of intensifying drought in the U.S., February 9 - March 15, 2002, courtesy National Drought Mitigation Center, University of Nebraska, Lincoln, Nebraska.
March 30, 2002 Narrowsburg, New York - Since the dry, warm fall and winter of 2001-2002, rivers on the East Coast of the United States have reached the lowest levels on record. In December, it was so bad in the Cannonsville Reservoir of the Delaware River watershed that its muddy bottom was exposed for the first time since it was built. That reservoir, which helps provide water to Manhattan, had only 3% of its water capacity. In fact, half the drinking water for New York City comes from three reservoirs in the Delaware River watershed and all three right now have less than half their normal water levels.
Click here to subscribe and get instant access to read this report.
Click here to check your existing subscription status.
"This was the warmest summer (2002) in the Antarctic Peninsula to date. The Antarctic Peninsula has one of the steepest warming trends of anywhere on earth and this event, the collapse of the Larsen B ice shelf, was the largest event of its kind in the last 30 years."
- Ted Scambos, Ph.D., Glaciologist,
Univ. of Colorado
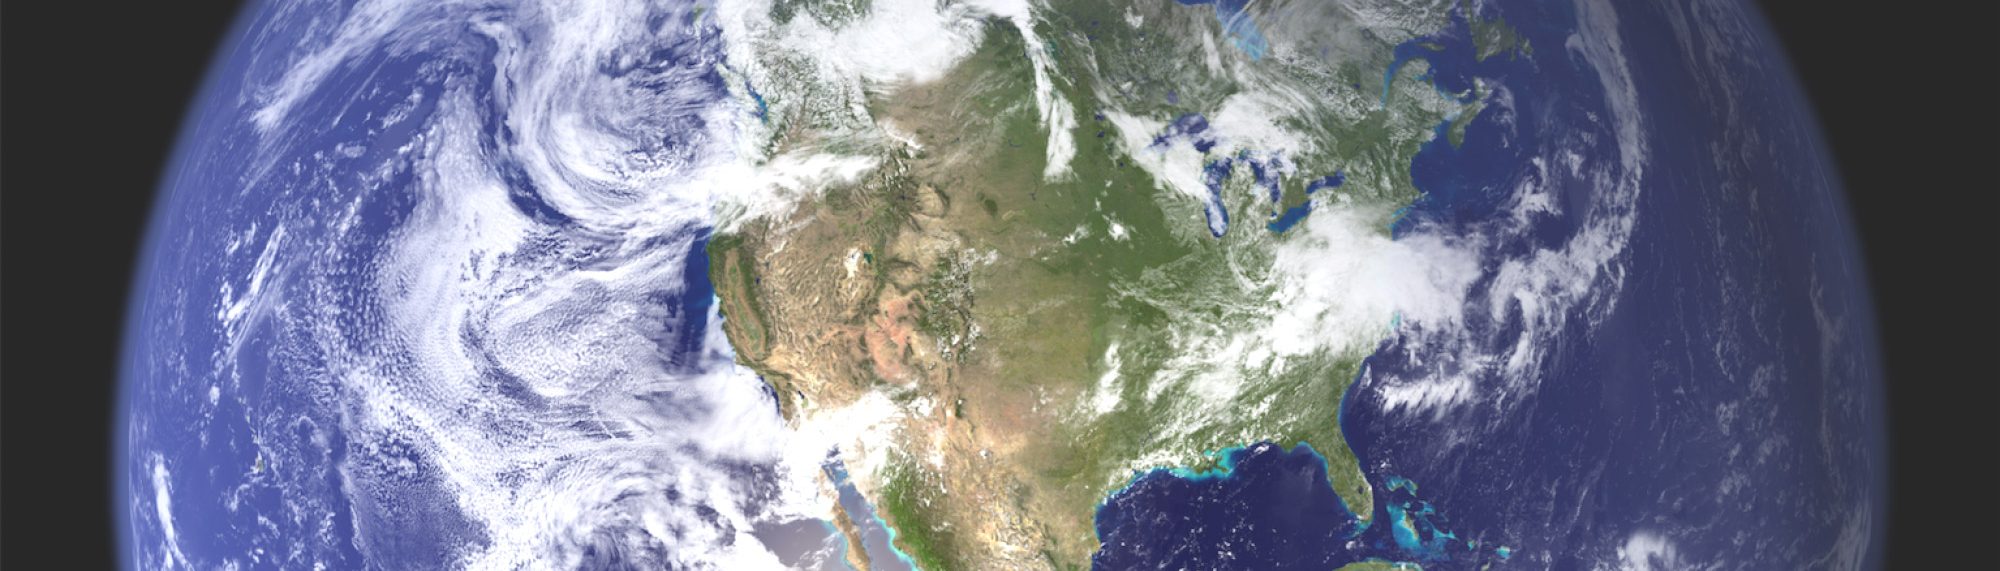
The Antarctic South Pole is covered by a continent the size of the United States. The Antarctic ice sheet which is 1.5 miles thick in some places, contains over 90% of the world's fresh water. The Antarctic Peninsula ice sheets that extend into the surrounding seas are melting rapidly, whether from global warming or local climate variations.
March 21, 2002 Boulder, Colorado - Scientists have been warning since 1997 that the Antarctic Peninsula and its Larsen B ice shelf were melting, but no one expected that by March 2002 the Larsen B would have disintegrated to only 40% of the size it was five years ago. But it has and in its collapse, one of the largest floating ice masses of the past thirty years has broken off. Nearly twice the size of Rhode Island covering 2,160 square miles (3,250 square kilometers) and 750 miles thick, iceberg B-22 was photographed on March 11, 2002 by the AVHRR satellite and reported by NOAA, the National Ice Center (NIC) and the University of Colorado's National Snow and Ice Data Center. The ice shelf has existed since the last ice age 12,000 years ago, and yet it disintegrated suddenly over a 35 day period that began the end of January 2002.
Click here to subscribe and get instant access to read this report.
Click here to check your existing subscription status.
El Nino means "the little boy" or "Christ child" in Spanish. South American fishermen used the name years ago to designate periodic cycles of unusually warm water in the Pacific ocean which appear around Christmas time. El Nino conditions occur once water temperatures have warmed enough (.5 degrees Celsius or more above normal) to alter normal cloudiness and rainfall in the Pacific basin. The cycle is every four or five years and can last up to eighteen months. The last El Nino was 1997-1998.
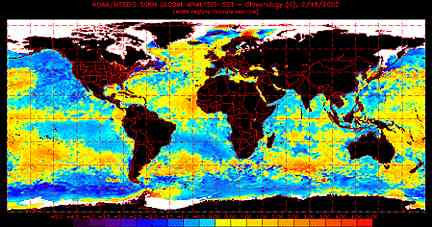
Pacific Ocean temperatures near the South American coast in February 2002 had warmed 2 degrees Celsius (4 Fahrenheit) indicating that El Nino conditions are developing. Map courtesy National Oceanic and Atmospheric Administration.
March 9, 2002 Washington, D. C. - Scientists at the National Oceanic and Atmospheric Administration (NOAA) announced on March 7 that ocean surface temperatures near the South American coast had already warmed 2 degrees Celsius (4 Fahrenheit) by February 2002.
Click here to subscribe and get instant access to read this report.
Click here to check your existing subscription status.
"Government officials said intelligence suggested that al-Qaeda
members had been considering attacking U. S. nuclear power plants
with car or truck bombs, boats or aircraft."
- Seth Borenstein, The Philadelphia Inquirer, January 31, 2002
February 4, 2002 Middletown, Pennsylvania - President George Bush said in his January 29, 2002 State of the Union speech that "diagrams of American nuclear power plants" were found among terrorist manuals and other artifacts left by terrorists in Afghanistan. Earlier on January 16, the Federal Bureau of Investigation (FBI) had issued an alert that a terrorist attack on a nuclear power plant could be imminent.
Click here to subscribe and get instant access to read this report.
Click here to check your existing subscription status.
Ross Ice Shelf in lower left quadrant of Antarctica map has been the source of Connecticut-sized icebergs dropping into the sea in recent years.
January 30, 2002 Pasadena, California - The huge Ross Ice Shelf in Antarctica is bigger than Texas and two-thirds of a mile thick. It has been the source of Rhode Island-sized icebergs in recent years in what was thought to be a continual slow melting in slippery mud at the bottom where the heavy ice layer pushes against the continental land mass. Since the last Ice Age ended ten thousand years ago, icy "rivers" have moved along that mud base and dumped Connecticut-sized icebergs into the sea in recent years.
Click here to subscribe and get instant access to read this report.
Click here to check your existing subscription status.
Industries and motor vehicles over the last century between 1900 and 2000 put 280 billion tons of carbon from carbon dioxide into the earth's atmosphere and oceans. That blanket of CO2 is warming the planet now and is expected to keep getting thicker and warmer throughout the next hundred years. The unpredictable consequence could be rapid global climate change and many plant and animal extinctions.The Philadelphia Inquirer, December 18, 2001, Philadelphia, Pennsylvania.
January 5, 2002 New York City, New York - In a Dreamland radio news report at the end of 2001, I talked with a Columbia University scientist about the risk of rapid global climate change as cars and industries put more and more carbon dioxide and other greenhouse gases into the atmosphere. (See Earthfiles 12/22/01.) Industries and motor vehicles over the last century between 1900 and 2000 put 280 billion tons of carbon from carbon dioxide into the earth's atmosphere and oceans. That blanket of CO2 is warming the planet now and is expected to keep getting thicker and warmer throughout the next hundred years. The unpredictable consequence could be rapid global climate change and many plant and animal extinctions.
Click here to subscribe and get instant access to read this report.
Click here to check your existing subscription status.
The National Oceanic and Atmospheric Administration (NOAA) reports that despite pre-existing La Nina conditions, global temperatures were above average during 2001. This map shows warmer than average temperatures were widespread across much of the United States and most of Europe. Temperatures in the red areas were 1.8 to 5.4 degrees Fahrenheit (1-3 degrees Centigrade) above average global annual temperatures between 1961 and 1990. The only cooler place was Australia where temperatures were between 1.8 to 5.4 degrees Fahrenheit (1-3 degrees Centigrade) cooler than average. Map and graphic below courtesy of NOAA.A shift to persistent global warming since the 1980s.
December 22, 2001 New York, New York - Recently the American Geophysical Union of scientists held its annual meeting in San Francisco. One of the presentations that made international news also appeared in a December National Academy of Sciences report. It warns that global warming, combined with increasing greenhouse gas pollution, could trigger a rapid climate change with unpredictable consequences. Scientists who have been studying the ice cores of Greenland and other regions of the world say the data indicates that climate changes in the past have included one sudden global temperature increase of 18 degrees Fahrenheit in only a decade or less.
Click here to subscribe and get instant access to read this report.
Click here to check your existing subscription status.